
Introduction To External Insulation
The external insulation (transmission line or substation) is exposed to electrical, mechanical, and environmental stresses. The applied voltage of an operating power system produces electrical stresses. The weather and the surroundings (industry, rural dust, oceans, etc.) produce additional environmental stresses.
The conductor weight, wind, and ice can generate mechanical stresses.
The insulators must withstand these stresses for long periods of time. It is anticipated that a line or substation will operate for more than 20–30 years without changing the insulators.
Environmental Stresses
Most environmental stress is caused by weather and by the surrounding environment, such as industry, sea, or dust in rural areas. The environmental stresses affect both mechanical and electrical performance of the line.
1. Temperature
The temperature in an outdoor station or line may fluctuate between –50°C and +50°C, depending upon the climate. The temperature change has no effect on the electrical performance of outdoor insulation.
It is believed that high temperatures may accelerate aging. Temperature fluctuation causes an increase of mechanical stresses, however it is negligible when well-designed insulators are used.
2. UV Radiation
UV radiation accelerates the aging of nonceramic composite insulators, but has no effect on porcelain and glass insulators. Manufacturers use fillers and modified chemical structures of the insulating material to minimize the UV sensitivity.
3. Rain
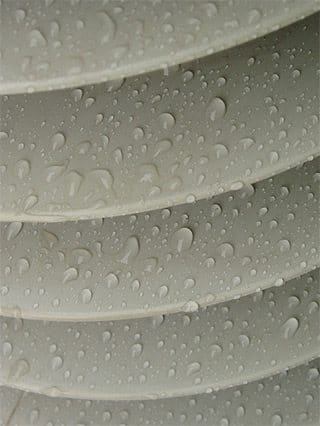
Rain wets porcelain insulator surfaces and produces a thin conducting layer most of the time. This reduces the flashover voltage of the insulators. As an example, a 230-kV line may use an insulator string with 12 standard ball-and-socket-type insulators.
Dry flashover voltage of this string is 665 kV and the wet flashover voltage is 502 kV. The percentage reduction is about 25%. Nonceramic polymer insulators have a water-repellent hydrophobic surface that reduces the effects of rain.
4. Icing
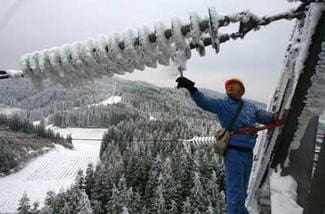
In industrialized areas, conducting water may form ice due to water-dissolved industrial pollution.
An example is the ice formed from acid rain water. Ice deposits form bridges across the gaps in an insulator string that result in a solid surface. When the sun melts the ice, a conducting water layer will bridge the insulator and cause flashover at low voltages.
Melting ice-caused flashover has been reported in the Quebec and Montreal areas.
5. Pollution
Wind drives contaminant particles into insulators. Insulators produce turbulence in airflow, which results in the deposition of particles on their surfaces. The continuous depositing of the particles increases the thickness of these deposits.
The continuous depositing and cleaning produces a seasonal variation of the pollution on the insulator surfaces. However, after a long time (months, years), the deposits are stabilized and a thin layer of solid deposit will cover the insulator.
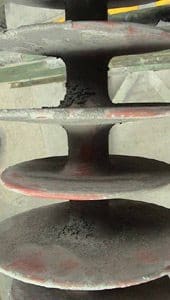
Because of the cleaning effects of rain, deposits are lighter on the top of the insulators and heavier on the bottom. The development of a continuous pollution layer is compounded by chemical changes. As an example, in the vicinity of a cement factory, the interaction between the cement and water produces a tough, very sticky layer.
Around highways, the wear of car tires produces a slick, tar-like carbon deposit on the insulator’s surface.
Moisture, fog, and dew wet the pollution layer, dissolve the salt, and produce a conducting layer, which in turn reduces the flashover voltage. The pollution can reduce the flashover voltage of a standard insulator string by about 20–25%.
Near the ocean, wind drives salt water onto insulator surfaces, forming a conducting salt-water layer which reduces the flashover voltage. The sun dries the pollution during the day and forms a white salt layer. This layer is washed off even by light rain and produces a wide fluctuation in pollution levels.
The Equivalent Salt Deposit Density (ESDD) describes the level of contamination in an area. Equivalent Salt Deposit Density is measured by periodically washing down the pollution from selected insulators using distilled water. The resistivity of the water is measured and the amount of salt that produces the same resistivity is calculated. The obtained mg value of salt is divided by the surface area of the insulator. This number is the ESDD.
The pollution severity of a site is described by the average ESDD value, which is determined by several measurements.
Table 1 shows the criteria for defining site severity.
The contamination level is light or very light in most parts of the U.S. and Canada. Only the seashores and heavily industrialized regions experience heavy pollution.
Table 1 – Site Severity (IEEE Definitions)
| Description | ESDD (mg/cm2) |
| Very light | 0–0.03 |
| Light | 0.03–0.06 |
| Moderate | 0.06–0.1 |
| Heavy | <0.1 |
Table 2 – Typical Sources of Pollution
| Pollution Type | Source of Pollutant | Deposit Characteristics | Area |
| Rural areas | Soil dust | High resitivity layer, effective rain washing | Large areas |
| Desert | Sand | Low resistivity | Large areas |
| Coastal area | Sea salt | Very low resistivity, easily washed by rain | 10–20 km from the sea |
| Industrial | Steel mill, coke plants, chemical plants, generating stations, quarries | High conductivity, extremely difficult to remove, insoluble | Localized to the plant area |
| Mixed | Industry, highway, desert | Very adhesive, medium resistivity | Localized to the plant area |
Typically, the pollution level is very high in Florida and on the southern coast of California. Heavy industrial pollution occurs in the industrialized areas and near large highways.
Table 2 gives a summary of the different sources of pollution. The flashover voltage of polluted insulators has been measured in laboratories. The correlation between the laboratory results and field experience is weak. The test results provide guidance, but insulators are selected using practical experience.
6. Altitude

The insulator’s flashover voltage is reduced as altitude increases. Above 1500 feet, an increase in the number of insulators should be considered. A practical rule is a 3% increase of clearance or insulator strings’ length per 1000 ft as the elevation increases.
Maintenance Of The Insulators
In zones where there is pollution, besides a good election of the insulator, is advisable to have a maintenance plan.
In other words, we need to wash or clean the insulator.
Cant see this video? Click here to watch it on Youtube.
This is more important in areas with severe environments of pollution or low rain probability, being necessary the elimination of the pollutant layer placed on the insulator.
Many times, the wash is carried out by hand. In general the most employed methods are: the wash by water to high, average or low pressure, with dry air compressed or with spurts of abrasive materials and more recently the use of ultrasonic.
Any of the techniques used has to guarantee that the insulator will not suffer damage, neither that we are going to get worse the present situation.
The wash with spurts of water is the most effective and economic method, if the contaminant is dust, salt or land, or if these pollutants are not much adhered to the surface.
If the contaminant element has a high adhesion, (for example the cement or pollutant originating from chemical businesses or by-products of the petroleum) we have to wash the insulator with abrasive elements. They can be smooth elements, as shattered shell of cobs of corn or shells of nut, fine dust of lime, or more abrasive elements as the fine sand.
Always the opinion of the manufacturer will be kept in mind for not damaging the surface of the insulator.
- The wash of the insulator will begin from lowest phase conductive.
- When we wash, the water should not fall directly on a dirty insulator.
- We will begin to wash from the lower part of the insulator until finishing in the upper part.
- Is very important to keep in mind the direction of the wind.
Resources:
- George G. Karady and R.G. Farmer | The electric power engineering – L L Grisby
- Insulator pollution in transmission lines – Ramos Hernanz, José A., Campayo Martín, José J., Motrico Gogeascoechea







Dear Sir,
Please see the following comments which I feel I must offer, please response to this. and please offer your valuable comments thereon.
– Effect of temp on the Insulation level.: With the rise of ambient temp the IR values show decreasing trend.
– Due to the moisture in the environment in the Rainy- seasons, the IR values decrease.
– Snow fall over the bushings/ insulators reduce insulation level.
– Due to the effect of pollution the creapage distance of bushings, CTs, CVTs/PTs, Circuit-Breakers and LAs.
Insulation is increased through increasing the creapage distance which is as follows;
• For Lightly polluted atmosphere: 16 mm/kV.
• For medium polluted atmosphere: 20 mm/kV.
• For heavily polluted atmosphere: 25 mm/kV.
• For very heavily polluted atmosphere: 31 mm/kV.
If the altitude is >1000m, the arching distance of the equipments needs to be enhanced as the air density at high altitudes is lower than that at sea level, thus the dielectric strength of air is reduced .The insulation level for which the arching distance is based for an altitude up to 1000 meters from the sea level, the same should be increased by 1% for each 100 meters in excess of 1000 meter.
thanks and regards.
Er.K.K.Murty.
Retd.Chief Engineer(Testing & Commun),MP power Transmission Co.Ltd.,Jabalpur .9INDIA
Dear Sir,
Please see the following comments which I feel I must offer,
Please response to this. and please offer your valuable comments thereon.
thanks and regards.
Er.K.K.Murty.
Retd.Chief Engineer(Testing & Commun),MP power Transmission Co.Ltd.,Jabalpur .9INDIA
I just read this article and found it very facinating. You should check out this blog post i wrote on why high voltage cable assemblies fail. http://blog.caton.com/blog/bid/293203/Top-5-Reasons-High-Voltage-Cable-Assemblies-Fail