
Power Demand
To select an on-site engine/generator sets (gensets), you’ll need to determine the power demand requirements which must be met under operating conditions, of course.
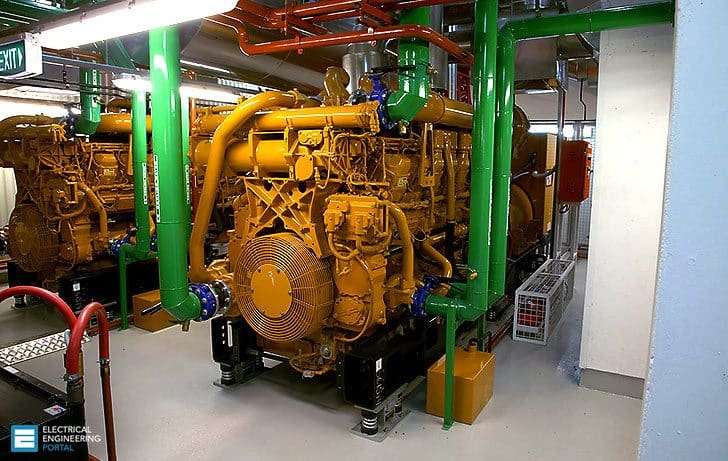 6 Customer Requirements For a Generator Regarding Power Demand (on photo: Three new Caterpillar 2.38MVA 3 Phase Generators and associated equipment; credit: ryanwilks.com.au)
Let’s talk about six recognized customer genset requirements regarding power demand //
- On Site Power Requirement
- Load Management
- Loads Profiles
- Estimating Load Data
- Categorizing Loads and
- VA/FT2 Load Estimating
1. On Site Power Requirement
Before selecting an engine model and rating, a load analysis needs to be performed. This section will consider the factors which affect generator sizing including load management needs, voltage and frequency dip limitations, motor starting considerations, start-up needs and all required standards.
Go back to Customer Requirements ↑
2. Load Management
Load management is the deliberate control of loads on a genset and/or utility to have the lowest possible electrical costs.
Go back to Customer Requirements ↑
3. Loads Profiles
The duration and nature of a load must be established to select and operate a genset system at maximum efficiency. To analyze a load, a family of load profile charts is necessary. Chronological and duration load profiles best serve this purpose.
The purpose of the monthly average number is to be able to graph a complete year and determine any seasonal variations. A daily chronological load curve, illustrated in Figure 1, shows load power demand throughout the day. A chronological curve establishes the peak daily power demand and an energy usage profile which can aid in the selection of an appropriately sized engine.
This load curve is also useful in programming units for economical operation.
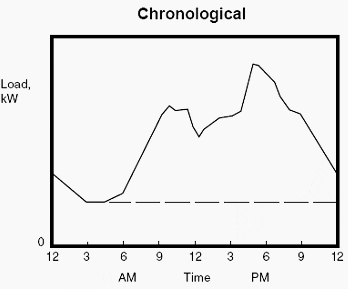
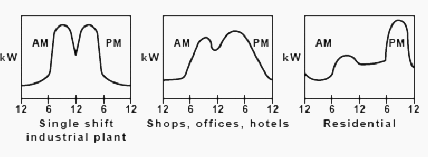
Daily typical peaks for various industries can be graphed based on typical loads as shown in Figure 2 below.
Duration curves, as shown in Figure 3, rearrange chronological curves and summarize daily load.
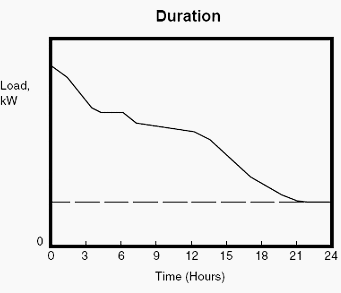
Such curves are developed for a week, month, season or year. The daily chart represents the average kilowatt load for each day, while the twelve-month chart, shown in Figure 4 below, represents the average kilowatt load for each month.
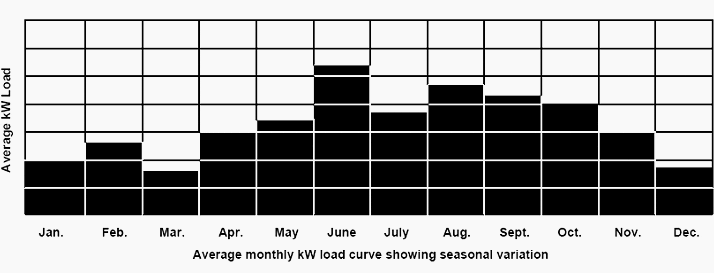
For existing loads that are served by a utility, power bills or power consumption records will provide the needed data for a twelve-month period.
The average kW load can be determined by the following equation:

Go back to Customer Requirements ↑
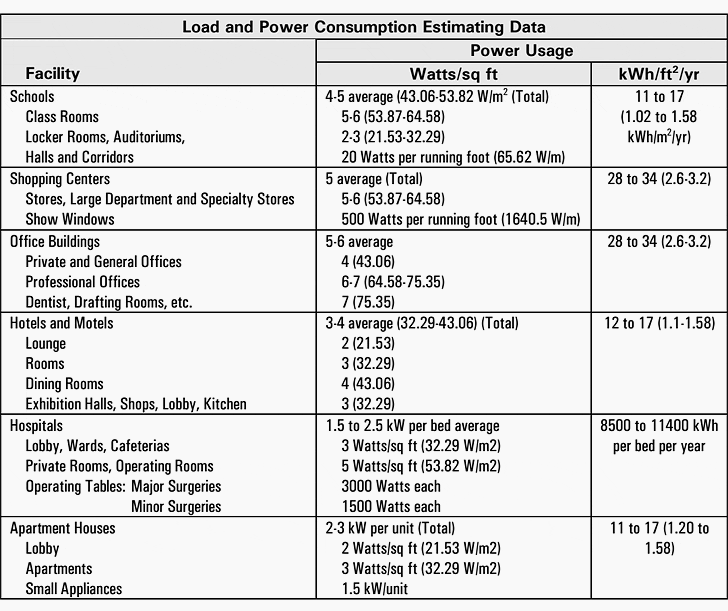
4. Estimating Load Data
Obviously, historical load data does not exist for a plant or facility not yet constructed. Table 1 estimates the average load of various facilities.
While these numbers will have variations depending on site conditions, they are reliable and helpful in making preliminary feasibility studies for installation.
Go back to Customer Requirements ↑
5. Categorizing Loads
When developing a load estimate, it is helpful to categorize lighting and power loads. These loads are distinctly different.
Power loads involve loads other than lighting. Examples are motors, furnaces and rectifiers. Unlike lighting loads, power loads vary based on a variety of factors; these including start and stop times, percentage of output and the associated power factor.
In addition to categorizing the loads, lighting and power loads are also estimated separately. The loads are later combined to determine the approximate total load.
Go back to Customer Requirements ↑
6. VA/FT2 Load Estimating
For estimating purposes, power loads and lighting loads can be measured in VA/FT2 . However, a detailed analysis requires individual measurement of power loads to ensure accuracy. A simple table, based on VA/FT2, is used to obtain a rough estimate of a load as expressed in total kVA generated. Table 2 below shows such a table.
Load Example //
Calculate the load for a 10,000 square foot office with electric air conditioning.
Solution //
The left-hand column of Table 2 below indicates the maximum lighting load in an office building is 4.0 VA/FT2. Therefore, the lighting load equates to:
4.0 VA/FT2 x 10,000 (square feet) = 40,000 VA
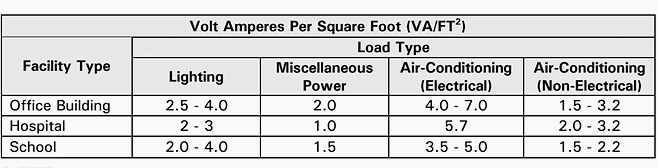
Reading the table from left to right:
2.0 VA/FT2 is required for miscellaneous power loads:
2.0 VA/FT2 x 10,000 (square feet) = 20,000 VA
7.0 A/FT2 is required for electrical air conditioning loads:
7.0 VA/FT2 x 10,000 (square feet) = 70,000 VA
Add the individual loads to determine the combined load:
40,000 + 20,000 + 70,000 = 130,000 VA
Go back to Customer Requirements ↑
Reference // Electric power applications, engine and generator sizing – Caterpillar


What affects when over load the generator say 20% approximately
It is good a great help enough to those newly practetioner
Very good
i want know more a bout the substation