
Estimated Study Time: 19 minutes
Corona Discharges
All the diverse ionization processes involved in producing corona discharges in the highly stressed regions near the conductors of transmission lines, as well as the creation and movement of charged particles in the electric field, require an expenditure of energy.
 Seven Bad Effects Of Corona On Transmission Lines (photo credit: rovdrone.eu)
This energy is supplied by the high voltage power source connected to the transmission line, which generates the high electric field near the conductors necessary to sustain corona discharges.
Most of the energy is converted to thermal energy for heating the air in the immediate vicinity of the conductors. A small proportion of the energy is converted to electromagnetic radiation including light emission, to acoustic energy, and to electrochemical energy required to produce gaseous effluents ozone and nitric oxides.
Let’s discuss now seven really bad effects on work of HV transmission lines:
- Corona Loss
- Electromagnetic Interference
- Audible Noise
- Ozone and NOx
- Light Emission
- Electrical Wind and Corona-Induced Vibrations
- Other Effects (microwave radiation and X rays)
1. Corona Loss
The power loss, defined by the rate at which energy is drawn by corona from the high voltage power source, is known as corona loss. Since the electromagnetic, acoustic, and electrochemical components are only a small part of the overall energy, corona loss is effectively caused by the movement of positive and negative ions in the electric field.
The lifetime of electrons created in the discharge, before they attach to neutral molecules and become negative ions, is very short, and consequently, their movement in the electric field gives rise only to short-duration current pulses, which do not contribute significantly to corona loss.
Before the onset of corona, the power source is called upon to supply mainly the capacitive current. The capacitive current flowing in the conductor gives rise to a small amount of I2R power loss.
At voltages above corona onset, however, the oscillatory movement of the ionic space charge in the alternating electric field near the conductor gives rise to an additional alternating current component.
The corona current also contributes to a small component in phase with the capacitive current, thus causing an apparent increase in the capacitance of the conductor configuration. Analytical treatment of corona loss on ac transmission lines is very complex and requires the solution of time-varying space charge fields.
Information required for design purposes is obtained mainly through experimental studies.
2. Electromagnetic Interference
Corona on transmission line conductors is generally confined to a number of point sources randomly distributed along the length of each conductor. The linear density of corona sources depends very much on the ambient weather and environmental conditions, with the lowest density occurring in fair weather and the highest in foul weather such as rain.
Both these modes of corona give rise to current pulses with fast rise time and short duration, as shown in Figure 1.
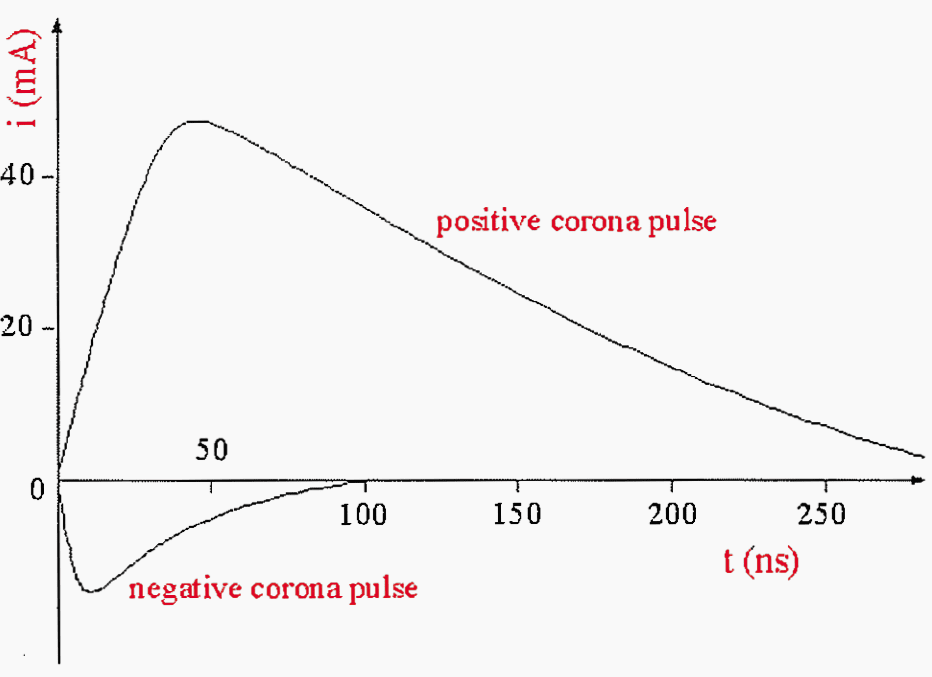
However, the parameters defining the three pulse shapes—namely, the amplitude, rise time, and duration—are quite different, as shown in Table 1. It is seen that gap discharge pulses have the highest amplitudes, fastest rise times, and shortest duration.
The amplitudes of positive corona pulses are about an order of magnitude higher than those of negative corona, while the latter have faster rise times and shorter duration.
Table 1 – Characteristics of Corona and Gap Discharge Current Pulses
| Type of Pulse | Amplitude (mA) | Rise time (ns) | Duration (ns) | Repetition Rate (pulses/s) |
| Positive Corona | 10 – 50 | 50 | 250 | 103 – 5.103 |
| Negative Corona | 1 – 10 | 10 | 100 | 104 – 105 |
| Gap Discharge | 500 – 2000 | 1 | 5 | 102 – 5.103 |
Transient current pulses such as those produced by corona and gap discharges generate EMI over a broad range of frequencies. The characteristics of EMI depend directly on the frequency spectral characteristics of current pulses, which are functions of the parameters defining the pulses as well as on the pulse repetition characteristics.
The amplitude of the frequency spectrum of a pulse is proportional to the product of the pulse amplitude and duration (charge content), while the bandwidth is an inverse function of the pulse rise time.
The relative frequency spectra of corona and gap discharges are shown in Figure 2.

Positive corona and gap discharge pulses have the highest amplitude of frequency spectrum, and gap discharges also have the widest frequency bandwidth, extending into the GHz range. The frequency spectrum of positive corona pulses begins to fall off rapidly at frequencies between 1 and 2 MHz, while that of negative corona pulses may extend up to about 100 MHz.
Gap discharges produce EMI covering both radio and television frequency bands and extending up to 1 GHz.
Because of the high impedance to ground, corona as well as gap discharges may be considered as current sources, injecting current pulses into the conductors of transmission and distribution lines. On transmission lines, each corona source injects a random train of current pulses into the conductor on which it is located. Sources on any conductor also induce currents of much lower amplitude in the other conductors of the line.
The current pulse injected at any point divides into two pulses, each with half the amplitude of the original pulse, traveling in opposite directions along the conductor.
The pulses are subject to attenuation and distortion as they travel, until the amplitude becomes insignificant. Depending on the impedance characteristics of the transmission line, the influence of a corona source extends only up to a finite distance on both sides.
Thus, the resultant current flowing at any point along the line is composed of randomly spaced pulses of varying amplitudes arriving from the randomly distributed sources and traveling in both directions.
Since the EMI generated by gap discharges, occurring mainly on distribution lines, extends to frequencies in the GHz range, analytical treatment becomes even more complex.
3. Audible Noise
The principal modes of corona on transmission lines – namely, negative Trichel streamers and positive onset streamers consist essentially of repetitive transient discharges in which rapid ionization takes place during a short interval of time on the order of a few hundred nanoseconds.
As a result, the local pressure inside the streamer channel is increased in accordance with physical laws governing gases. The local increase in the gas pressure corresponds, by definition, to the generation of an acoustic pressure wave propagating outwardly from the discharge site.
The typical shape of a single acoustic pulse generated by a pulsative corona discharge is shown in Figure 3 below.

The acoustic pulses due to both positive and negative corona have similar shapes, but the amplitudes at positive polarity are an order of magnitude higher than those at negative polarity, similar to current pulse amplitudes. As in the case of EMI, therefore, positive corona is the main source of audible noise on transmission lines.
The frequency spectrum of the corona-generated acoustic pulse extends wider than the normal audible range of humans – i.e., above 15 kHz.
The random trains of acoustic pulses produced by different sources distributed along the conductor travel different distances in air to arrive at a point in space near ground level where a human observer may be located. Because of their random distribution in space and time, acoustic waves arrive at the point of observation with random phase relationships.
In addition to the random component described above, audible noise from ac transmission lines also includes one or more pure tones, which are produced by the oscillatory movement of ionic space charges created in the vicinity of the conductor in both half cycles of the alternating voltage.
As they oscillate in the alternating electric field near the conductor, the ions transfer their kinetic energy through elastic collisions to the air molecules and give rise to an acoustic pure tone called hum at a frequency twice that of the power frequency (i.e., 120 Hz for a 60Hz system).
Higher harmonics may also be present in hum, but usually of much lower magnitudes. Because of the similarities in the physical mechanisms involved, hum noise is well correlated with corona loss.
4. Ozone and NOx
Complex electrochemical reactions take place within the discharge processes of positive and negative corona, resulting in the generation of ozone O3, and various oxides of nitrogen, collectively known as NOx.
Dissociation of oxygen molecules in air due to the ionization processes creates atomic oxygen, which in subsequent reactions gives rise to ozone and nitric oxides.
5. Light Emission
The processes leading to corona discharges in air give rise to excitation as well as ionization of molecules. The excited molecules, in which the outermost orbital electrons are bumped to a higher energy state, emit photons when they revert to their original energy state.
Visual observations show that the light is of pale bluish color. Studies of the emission spectra of corona discharges indicate that most of the light is emitted from excited nitrogen molecules.

Figure 4 shows the typical spectrum of light emitted by corona discharges in air. The spectrum of visible solar radiation is also shown in the figure.
It is seen that corona produces mainly low-intensity ultraviolet radiation at the edge of the solar light spectrum.
6. Electrical Wind and Corona-Induced Vibrations
In addition to the widely observed effects described above, corona discharges also produce less well-known effects such as electrical wind and corona-induced vibrations.
In cases of both positive and negative corona, ions of the same polarity are created and repelled from the highly stressed conductor.
The presence of water drops on conductors during rainy weather may sometimes cause the conductors to vibrate at very low frequency (1-5 Hz), giving rise to corona-induced vibrations. Water drops on conductors are elongated in the presence of high levels of conductor surface electric field, causing them to eject water droplets.
The repulsive electrostatic forces between the ejected drop and the suspended drop, along with the reactive force produced by corona-generated electrical wind as well as by water ejection, exert an upward force on the conductor.
Meanwhile, the suspended drop is replenished and is again elongated in the electric field.
Corona-induced vibration is excited, first, by electrostatic forces, mainly the Coulombic repulsive forces and reactive force caused by ionic wind. The amplitude of the vibration is then amplified by the mechanical reactive force in the ejection of drops or droplets from the suspended drops.
7. Other Effects
Microwave Radiation and X Rays?
In addition to the various effects described above that have been subject to experimental and analytical investigations, there has been some speculation in environmental public hearings and even in scientific literature that corona on transmission line conductors may give rise to other effects that lead to adverse environmental impact.
It is useful to consider the plausibility of some of the more notorious of these effects.
Corona-generated EMI at frequencies up to 1 GHz have been measured from power lines operating at voltages up to 800 kV. EMI measurements have also been made more recently at 900 MHz on 230kV and 500kV double-circuit lines in rainy weather.
These studies indicate that measurable EMI may be produced by transmission lines even at frequencies above 1 GHz, but the levels fall off inversely proportional to the frequency. Consequently, any EMI produced by transmission lines in the low microwave frequencies could be detected only in rainy weather, and the levels are so low as not to pose any health risks.
It was also speculated that electrons created by corona on conductors may interact with ambient water molecules to produce microwave radiation in the X and K bands (9 – 25 GHz). A laboratory study (DeVore and Ungvichian 1975) has shown, however, that no measurable radiation was produced at these frequencies.
Similarly, the possibility of X ray production due to corona on transmission line conductors was raised at some environmental hearings, but consideration of the physics involved shows that it is not plausible. Ionization processes in air at atmospheric pressure produce photons at energies corresponding to visible and ultraviolet light as shown in Figure 4.
Since photons of X rays have energies that are two to three orders of magnitude higher than those of ultraviolet radiation, it is physically not possible for corona and gap discharges to produce X rays.
Apart from conductors and hardware, corona may occur on the surfaces of insulation, such as nonceramic insulators and fiber optic cables, causing erosion and eventually leading to insulation failure. Finally corona may also occur on the sharp tips of leaves, vegetation, and other objects located in close proximity of transmission line conductors.
Reference // EPRI AC Transmission Line Reference Book – 200kV and Above
Related electrical guides & articles


Edvard Csanyi
Hi, I'm an electrical engineer, programmer and founder of EEP - Electrical Engineering Portal. I worked twelve years at Schneider Electric in the position of technical support for low- and medium-voltage projects and the design of busbar trunking systems.I'm highly specialized in the design of LV/MV switchgear and low-voltage, high-power busbar trunking (<6300A) in substations, commercial buildings and industry facilities. I'm also a professional in AutoCAD programming.
Profile: Edvard Csanyi

Thanks for Sharon very good information,
Can you please send me books, information notes etc .for me about How to avoid more tripping in 11kv , 33kv ,220kv OHL network
3319 N Fowler,FRESNO CA 9327
Dear sir,
realy you share a very important subject about electro-technical engineering, and such I’m an engineer in this doman; I want more about those subjects, or you send me more books or links, and why not build a new relationship with you sir.
please accept my best salutations