


Estimated Study Time: 29 minutes
Standard PF Correction Not Working
This technical article explores a real-world case study detailing the catastrophic consequences of applying standard power factor correction in a modern industrial facility dominated by non-linear loads. Industrial plants traditionally install shunt capacitor banks to improve electrical efficiency and avoid costly utility penalties associated with lagging reactive power.
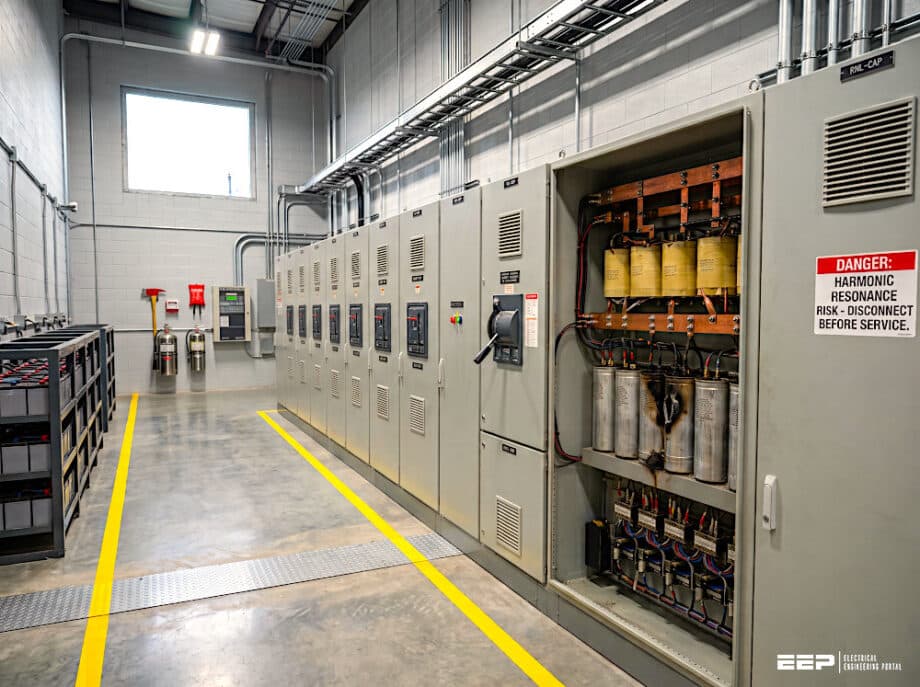 Case Study: Harmonic Resonance and Mitigation in Power Factor Correction at an Industrial Facility
However, the widespread use of Variable Frequency Drives (VFDs) in processes like plastic extrusion introduces significant high-frequency harmonic currents into the electrical distribution network. When standard capacitors are installed in such highly distorted environments, their decreasing reactance at higher frequencies makes them highly vulnerable to these harmonic currents.
In the featured plastic extrusion plant, this interaction created a parallel LC resonance between the newly installed capacitors and the facility’s supply transformers. Because the resonant frequency aligned closely with the seventh harmonic generated by the VFDs, the system experienced extreme electrical amplification.
This severe instability immediately led to overheating transformers, blown protective fuses, and the explosive dielectric failure of the new capacitor banks. To safely resolve this crisis, engineers removed the standard capacitors and designed a custom passive harmonic filtration system utilizing detuned reactors.
Ultimately, this engineered solution allowed the plant to safely achieve regulatory power factor compliance while simultaneously absorbing damaging harmonics and restoring complete operational stability.
- Introduction to Power Systems Efficiency
- Theoretical Framework of Reactive Power and Harmonics:
- Case Study Overview: The Plastic Extrusion Facility:
- The Initial Corrective Action and Subsequent Equipment Failure:
- Power Quality Investigation and Resonance Analysis:
- Engineered Mitigation Strategy: Passive Harmonic Filtration:
- Post-Implementation Results and Compliance:
- Summary
- Attachment (PDF) 🔗 The Reactive Power Handbook: Principles for Efficient Supply and Reliable Consumption
1. Introduction to Power Systems Efficiency
In AC distribution networks, efficiency is fundamentally governed by the relationship between real power, which performs actual thermodynamic or mechanical work, and reactive power, which sustains the magnetic and electric fields requisite for the operation of inductive and capacitive loads. Power factor is the primary metric utilized by utility providers and facility engineers to quantify this efficiency.
Industrial environments, particularly those heavily reliant on induction motors, transformers, and high-intensity discharge lighting, inherently draw substantial lagging reactive power.
This operational characteristic results in a degraded power factor, compelling the electrical infrastructure to carry higher total currents than strictly necessary for the active power demand.
Utility companies penalize industrial consumers for low power factor because the excess current necessitates the oversizing of transmission lines, switchgear, and generation assets to prevent thermal overload and excessive voltage drop.
Consequently, industrial facilities routinely implement Power Factor Correction (PFC) strategies. The conventional approach involves installing shunt capacitor banks that provide leading reactive power, locally canceling out the lagging reactive power demanded by the inductive loads.
This article examines a real-world case study of a plastic extrusion facility where a standard reactive power compensation initiative resulted in severe system instability, and details the rigorous engineering methodology applied to diagnose and resolve the phenomenon.
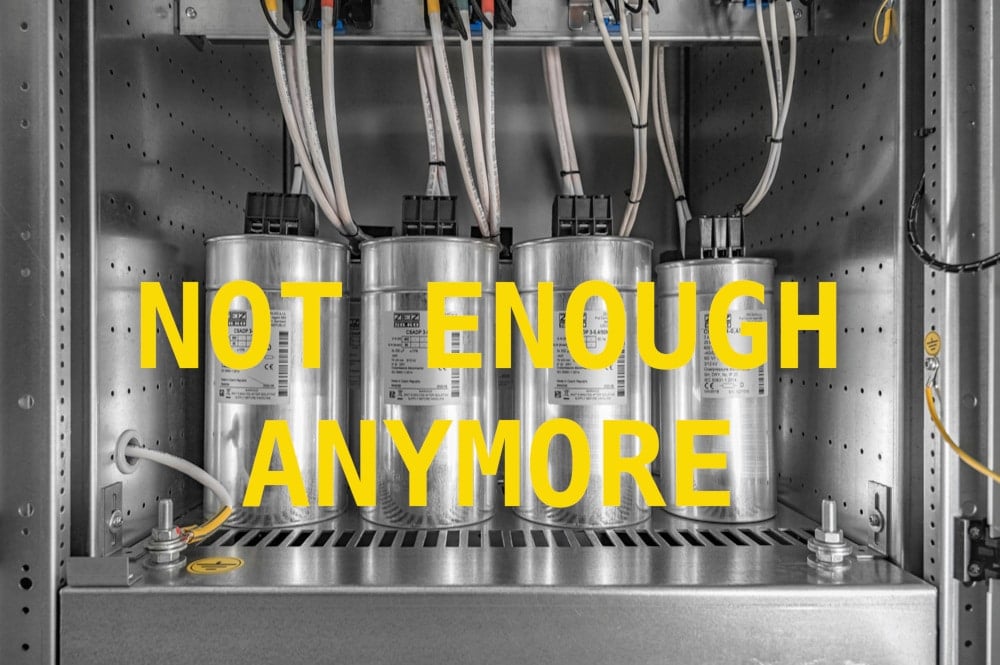
Figure 1 – Standard reactive power compensation is not enough anymore
2. Theoretical Framework of Reactive Power and Harmonics
To comprehensively analyze the failure mechanism in the case study, it is necessary to establish the theoretical principles governing power factor in the presence of harmonic distortion.
2.1. Displacement Power Factor vs. True Power Factor
In classical, purely sinusoidal electrical systems, the power factor is defined merely as the cosine of the phase angle (θ) between the fundamental voltage and fundamental current waveforms. This metric is explicitly defined as the Displacement Power Factor (DPF):
DPF = cos(θ1)
Apparent power (S), measured in Volt-Amperes (VA), is the vector sum of active power (P) and reactive power (Q):
S = √(P2 + Q2)
However, this conventional model is insufficient for systems containing non-linear loads. Non-linear loads draw current that does not perfectly mirror the sinusoidal voltage waveform supplied by the source.
TPF accounts for the total apparent power, inclusive of all harmonic frequencies:
TPF = Ptotal / Stotal
When harmonic distortion is present, the True Power Factor will always be lower than the Displacement Power Factor. A facility may correct its DPF to near unity using standard capacitors, but if harmonic currents are excessively high, the TPF will remain suboptimal, and the standard capacitors will be subjected to operating conditions outside their design parameters.
Learn the Basics – What is harmonic distortion in a power system, and how to minimize the impacts
What is harmonic distortion in a power system, and how to minimize the impacts
2.2. The Nature of Non-Linear Loads
Non-linear loads operate by switching the incoming AC voltage at high speeds to control the power delivered to the end process. The most prevalent non-linear loads in heavy industry are Adjustable Speed Drives (ASDs) or Variable Frequency Drives (VFDs) utilized to control the speed and torque of AC induction motors.
A standard six-pulse VFD utilizes a full-wave diode bridge rectifier to convert incoming AC power to a DC bus voltage, which is then inverted back to a synthesized, variable-frequency AC voltage using Insulated-Gate Bipolar Transistors (IGBTs). The rectifier section draws current from the AC line only when the instantaneous line voltage exceeds the DC bus voltage. This results in current being drawn in abrupt, non-continuous pulses rather than a smooth sinusoid.
For a balanced, six-pulse rectifier configuration, the characteristic harmonic orders (h) injected back into the power system are defined by the equation:
h = (n × p) ± 1
Where:
- n is any integer (1, 2, 3, …)
- p is the pulse number of the rectifier (typically 6)
Therefore, a standard six-pulse drive fundamentally generates 5th, 7th, 11th, and 13th harmonic currents. These harmonic currents flow from the non-linear load back toward the lowest impedance point in the system, which is typically the utility source transformer.
As these currents flow through the inherent inductive impedance of the facility’s distribution cables and transformers, they induce harmonic voltage drops, distorting the voltage waveform for all other equipment connected to the common bus.
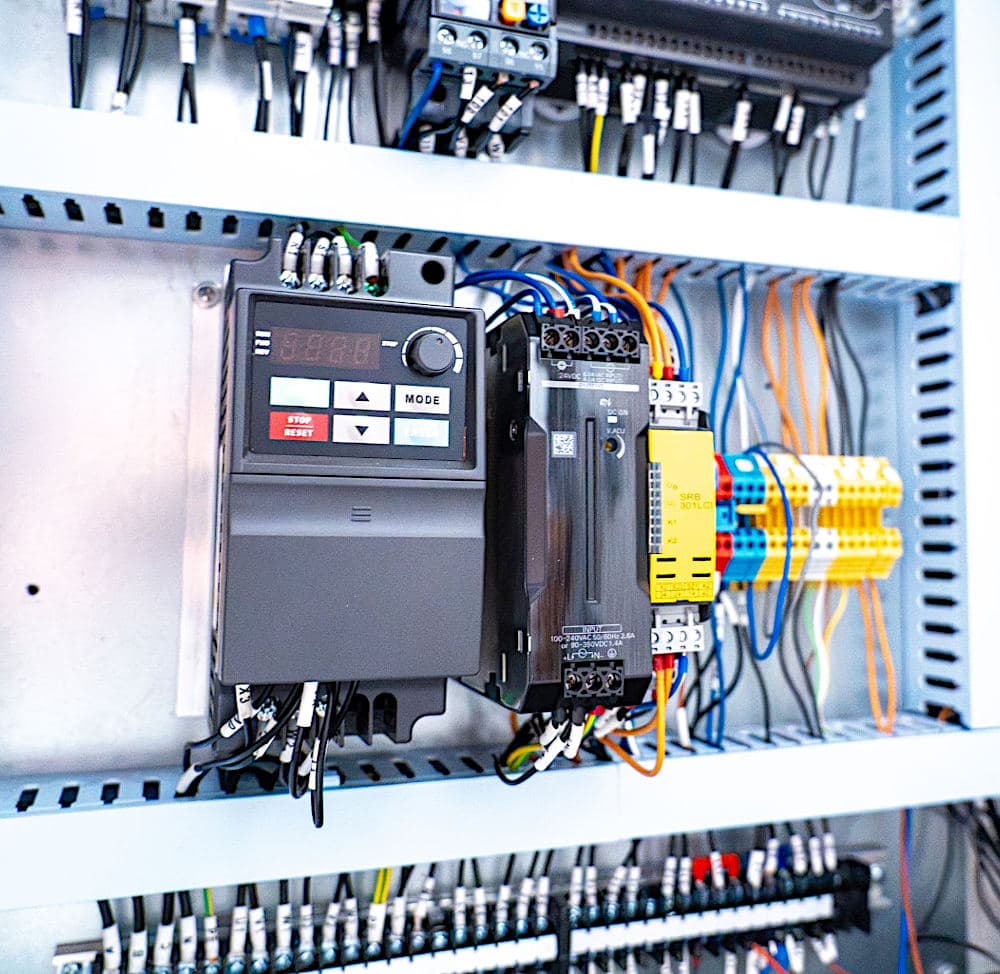
Figure 2 – Six-pulse Variable Frequency Drive
2.3. Harmonic Injections and IEEE Std. 519
The Institute of Electrical and Electronics Engineers (IEEE) established the IEEE Std. 519 to provide recommended practices and requirements for harmonic control in electrical power systems.
The standard defines strict limits on the allowable Total Harmonic Distortion (THD) for both voltage (THDV) and current (THDI) at the Point of Common Coupling (PCC), the juncture where the utility infrastructure interfaces with the consumer’s facility.
Total Harmonic Distortion is mathematically defined as the ratio of the root mean square (RMS) of the harmonic content to the RMS value of the fundamental quantity, expressed as a percentage:
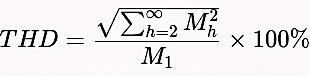
Where Mh represents the magnitude of either voltage or current at the h-th harmonic, and M1 is the magnitude of the fundamental frequency component.
Compliance with IEEE Std. 519 is mandatory in many jurisdictions and is critical for ensuring that an industrial facility does not contaminate the wider utility grid with disruptive harmonic frequencies.
3. Case Study Overview: The Plastic Extrusion Facility
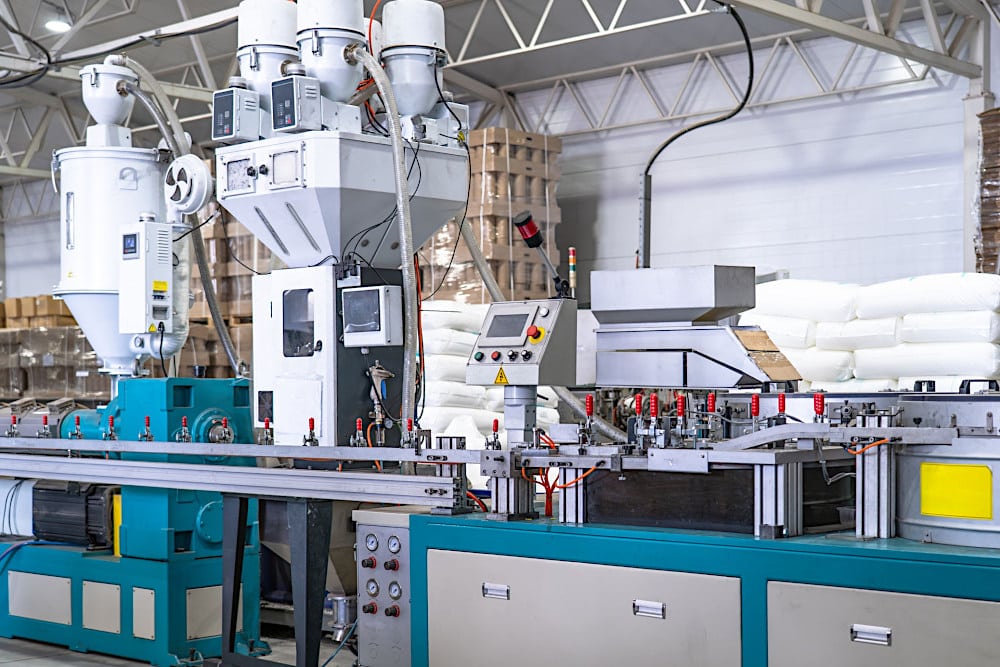
This case study analyzes a comprehensive power quality incident at an industrial plastic extrusion plant. Plastic extrusion processes are characterized by high mechanical torque requirements, sustained heavy loading, and precise speed regulation to ensure product uniformity.
Figure 3 – Typical plastic extrusion production line
3.1. System Architecture and Substation Parameters
The industrial facility was fed by a dedicated 44 kV utility substation. The utility supply stepped down the high voltage to intermediate distribution voltages via several multi-megawatt power transformers. The primary Point of Common Coupling was evaluated at the 44 kV level.
The essential parameters of the utility supply at the substation were:
- Utility Substation Voltage: 44 kV
- Available Three-Phase Fault Current: 4.12 kA
- Three-Phase Short Circuit Capacity (MVASC): Calculated to assess the stiffness of the grid.
MVASC = √3 × VL-L × ISC
MVASC = √3 × 44 kV × 4.12 kA ≈ 314 MVA
The ratio of the short-circuit MVA at the PCC to the average maximum demand load of the facility (15,100 kVA) was approximately 20.8. This established the specific IEEE Std. 519 current distortion limits applicable to the plant.
3.2. Load Profile and Power Factor Penalties
The core of the manufacturing operation consisted of massive plastic extruder motors. These motors were driven by 2.5 MVA, 4.16 kV six-pulse Adjustable Speed Drives. While the drives provided the necessary process control, their six-pulse topology meant they were injecting significant 5th and 7th harmonic currents back into the facility’s 4.16 kV distribution bus.
Prior to intervention, the facility operated with a notably low Displacement Power Factor. Because VFDs utilize a diode bridge rectifier, the displacement power factor of the drives themselves is relatively high; however, the facility also operated numerous direct-on-line (DOL) auxiliary induction motors, cooling fans, and large step-down transformers that drew heavily lagging current.
The aggregate power factor fell significantly below the utility’s mandatory 0.95 threshold, resulting in punitive financial surcharges levied against the facility’s monthly electrical billing.
Further Study – Load flow analysis of 138/69 kV substation using ETAP
Load flow analysis of 138/69 kV substation using ETAP (Electrical Transient & Analysis Program)
4. The Initial Corrective Action and Subsequent Equipment Failure
To mitigate the financial penalties, plant management authorized the installation of localized power factor correction equipment on the secondary side of the distribution network.
4.1. Application of Standard Shunt Capacitors
The initial design approach was strictly conventional. Electrical contractors calculated the deficit in reactive power and installed standard, un-detuned shunt capacitor banks across the lower voltage buses. The primary objective was to inject leading kVAR to offset the lagging kVAR of the induction motors and transformers, thereby shifting the phase angle θ closer to zero and restoring the DPF to unity.
Upon energization of the capacitor banks, the facility’s power factor meters immediately reflected an improvement, exceeding the 0.95 requirement.
However, this apparent success was abruptly overshadowed by severe operational anomalies that manifested within days of commissioning.
4.2. Catastrophic Failure Mechanisms
The facility began experiencing a cascade of electrical failures directly correlated to the activation of the new capacitor banks. The symptoms included:
1. Transformer Overheating: The primary step-down transformers began operating at temperatures vastly exceeding their thermal ratings, triggering temperature alarms. Transformer core losses (comprising hysteresis and eddy current losses) are highly frequency-dependent. Eddy current losses, in particular, scale with the square of the frequency.
The presence of high-frequency harmonic currents dramatically increased the I2R heating within the transformer windings, accelerating insulation degradation.
2. Capacitor Fuse Ruptures: The protective HRC (High Rupturing Capacity) fuses dedicated to individual capacitor steps began blowing indiscriminately.
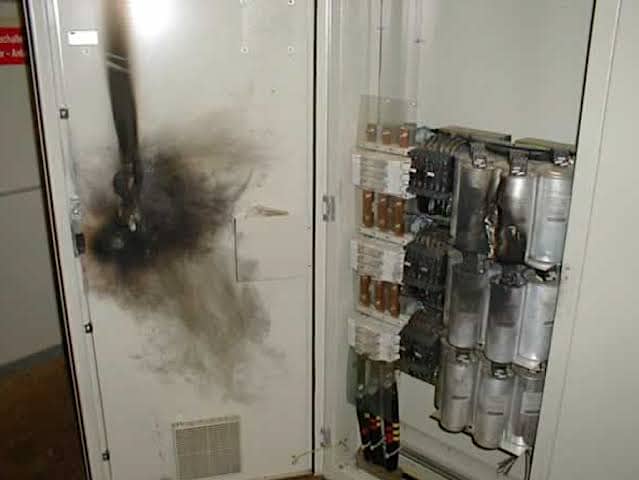
3. Dielectric Breakdown and Rupture: Several cylindrical capacitor canisters physically bulged, leaked dielectric fluid, and ultimately suffered explosive failure.
The capacitor failures were driven by fundamental electrical physics. The reactance of a capacitor (Xc) is inversely proportional to frequency (f):
Xc = 1 / 2πfC
Here is a realistic photo showing what happens when a power factor correction capacitor bank catastrophically fails and explodes due to severe harmonic resonance and overvoltage:
Figure 4 – PFC capacitor bank catastrophically failed and exploded
5. Power Quality Investigation and Resonance Analysis
In response to the catastrophic equipment degradation, an independent power quality engineering firm was contracted to perform a highly rigorous IEEE Std. 519 compliance evaluation and system analysis. The investigation utilized advanced power system simulation software (SuperHarm) to model the plant’s electrical topology from the 44 kV substation down to the 4.16 kV and 480 V load buses.
5.1. Harmonic Impedance Modeling
The core objective of the simulation was to generate an impedance versus frequency characteristic of the facility’s electrical network. Every electrical system contains inherent inductance (L), primarily localized within the windings of the utility supply transformers and facility distribution transformers.
The introduction of the standard power factor correction capacitors (C) formed a parallel Inductor-Capacitor (LC) circuit relative to the harmonic current sources (the VFDs).
In a parallel LC circuit, the inductive reactance (XL = 2πfL) increases linearly with frequency, while the capacitive reactance (Xc = 1 / 2πfC) decreases.
At the parallel resonant frequency, the equivalent impedance of the parallel combination approaches infinity from the perspective of the harmonic current source. If the non-linear loads inject even a minimal amount of harmonic current at or near this specific resonant frequency, the resultant harmonic voltage (Vh = Ih × Zh) will be exponentially amplified.
This high harmonic voltage then forces massive circulating currents to oscillate endlessly back and forth between the transformer inductance and the capacitor bank, severely thermally overloading both components.
Further Study – The essentials of harmonic filtering techniques
5.2. Mathematical Derivation of Parallel Resonance
The simulation revealed that the addition of the shunt capacitor banks shifted the system’s natural resonant frequency dangerously close to the dominant harmonics produced by the drives. The specific parallel resonant frequency order (hr) can be calculated using a simplified expression relating the system’s short circuit capacity and the capacitor bank rating:
hr = √ MVASC / MVArCap
Where:
- hr = Parallel resonant frequency expressed as a multiple of the fundamental frequency (e.g., 60 Hz).
- MVASC = Three-phase short circuit capacity of the system at the bus (314 MVA).
- MVArCap = Total three-phase rating of the connected capacitor bank in Megavolt-Amperes Reactive.
The SuperHarm simulation verified that the standard capacitor banks created a severe parallel resonance at exactly 468 Hz. In a 60 Hz electrical system, 468 Hz corresponds precisely to the 7.8th harmonic (60 Hz × 7.8 = 468 Hz).
The ensuing circulating currents were responsible for the rapid destruction of the capacitor dielectric and the severe overheating of the distribution transformers.
What is the SuperHarm simulation?
SuperHarm is an advanced power system simulation software used by electrical engineers to model and analyze the power quality and electrical topology of a facility.
In the context of the extrusion plant case study, the software was utilized to:
- Model the Electrical Network: Map the plant’s entire electrical infrastructure, from the 44 kV utility substation down to the 4.16 kV and 480 V load buses.
- Analyze Impedance and Frequency: Generate an impedance versus frequency characteristic of the network to understand how the system reacts to the high-frequency harmonic currents injected by the variable frequency drives.
- Identify Resonance: Pinpoint the exact mathematical cause of the equipment failures by calculating that the standard capacitor banks created a severe parallel resonant point at exactly 468 Hz (the 7.8th harmonic).
- Validate the Solution: Verify mathematically that the proposed 4.7th detuned harmonic filter would successfully shift the resonant frequency down to a safe, benign level (the 3.7th harmonic) before any physical equipment was installed.
6. Engineered Mitigation Strategy: Passive Harmonic Filtration
Removing the capacitor banks would stop the catastrophic failures but would immediately reinstate the severe utility power factor penalties. That sounds bad. The engineering mandate was to provide the required reactive power compensation without triggering parallel harmonic resonance.
The solution necessitated the removal of the standard, un-detuned capacitors and the design and installation of custom-engineered passive harmonic filters at the 4.16 kV bus feeding the non-linear loads.
6.1. Designing the Detuned Filter
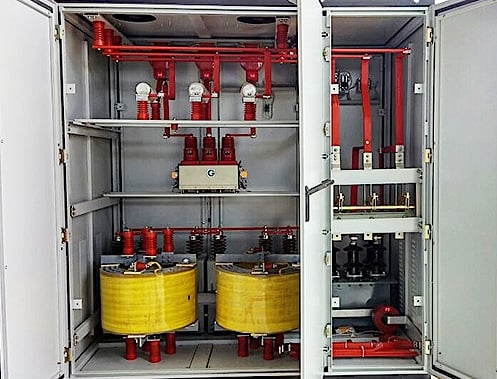
A passive harmonic filter consists of a power factor correction capacitor bank connected in series with a specifically sized iron-core inductor, known as a detuned reactor.
The design implemented at the facility involved a new 1,200 kVAr, 4.16 kV harmonic filter. The objective of connecting the reactor in series with the capacitor is to deliberately alter the resonant frequency of the localized LC circuit. The filter is engineered so that its series resonant point, where it presents the lowest possible impedance, is tuned just below the lowest predominant harmonic frequency generated by the load.
The tuning frequency of the filter (hfilter) is defined by the relationship between the capacitive reactance (Xc) and the filter inductive reactance (XF):
hfilter = √ (Xc / XF)
By sizing the reactor (XF) appropriately, the 1,200 kVAr capacitor was tuned to 4.7. At the fundamental frequency (60 Hz), the capacitive reactance massively outweighs the inductive reactance of the series reactor.
Therefore, at 60 Hz, the filter assembly operates predominantly as a capacitor, injecting the necessary 1,200 kVAr of leading reactive power into the 4.16 kV bus to successfully correct the displacement power factor.
Figure 5 – Detuned harmonic filter panel with large iron-core reactors visible at the bottom
6.2. Shifting the Resonant Pole
The most critical function of the 4.7th harmonic filter was its impact on the system’s parallel resonance. By presenting a highly inductive impedance to all frequencies above the 4.7th harmonic (including the problematic 5th and 7th), the detuned filter fundamentally cannot resonate with the inductive source impedance of the utility transformer at those higher frequencies.
However, adding a tuned filter always creates a new parallel resonant point at a frequency below the notch frequency. The new system parallel resonant frequency (hr,new) with the 4.7th filter in service was modeled mathematically:
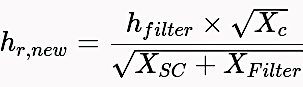
The SuperHarm simulation verified that the new parallel resonant frequency was safely shifted down to approximately the 3.7th harmonic (222 Hz). Because standard six-pulse drives do not generate any harmonic currents at the 3.7th or 4th harmonic order, there is no excitation energy available at that frequency.
Consequently, the newly established resonant point remained entirely benign, completely eliminating the risk of harmonic amplification.
Good Reading – The magic I used to reduce harmonics in a plant (a real case study)
The magic I used to reduce harmonics in a plant (a real case study)
7. Post-Implementation Results and Compliance
Following the commissioning of the 1,200 kVAr, 4.7th tuned harmonic filter, the facility underwent extensive power quality logging to validate the engineering design.
7.1. Reduction of Total Harmonic Distortion (THD)
The passive filter operated exactly as modeled. At the 5th harmonic, the filter presented an impedance significantly lower than the utility source impedance. Consequently, a large portion of the 5th harmonic current generated by the extruders safely shunted into the robustly designed filter rather than flowing back into the utility grid or oscillating within the facility’s distribution network.
The resulting current waveform at the Point of Common Coupling was analyzed using an inverse Discrete Fourier Transform (DFT). The simulated and subsequently verified current Total Harmonic Distortion (THDI) at the PCC was reduced to an exceptional 3.2%.
Voltage distortion was similarly suppressed well below the strict 5% limitation mandated by IEEE Std. 519.
7.2. Economic and Operational Validation
From an operational standpoint, the implementation of the detuned reactor system resolved all equipment degradation issues. The distribution transformers returned to standard operating temperatures, as the high-frequency eddy current losses were eliminated.
The capacitors, now protected by the series reactors from the thermal stress of high-order harmonic currents, operated reliably without any further dielectric breakdowns or fuse ruptures.
The capital expenditure required for the engineered filter panels achieved a complete return on investment through utility savings within the first operational year, proving the viability of applying advanced harmonic mitigation in complex industrial environments.
Good Reading – The Rise of Harmonic Distortion in Modern Power Systems
8. Summary
This case study clearly delineates the critical boundaries of standard reactive power compensation. The modern industrial landscape, characterized by the pervasive use of variable frequency drives and non-linear power electronics, renders the uncalculated installation of standard shunt capacitors an obsolete and highly dangerous practice.
As demonstrated at the plastic extrusion facility, ignoring the harmonic profile of a network during power factor correction invariably risks triggering parallel LC resonance.
A rigorously engineered approach, utilizing accurate system impedance modeling and the application of detuned passive harmonic filters or Active Harmonic Filters (AHF), is the only definitive methodology to simultaneously achieve regulatory power factor compliance and maintain operational electrical stability in heavy industrial applications.
9. Attachment (PDF): The Reactive Power Handbook: Principles for Efficient Supply and Reliable Consumption
Download: The Reactive Power Handbook: Principles for Efficient Supply and Reliable Consumption (for premium members only):
Related electrical guides & articles







Edvard Csanyi
Hi, I'm an electrical engineer, programmer and founder of EEP - Electrical Engineering Portal. I worked twelve years at Schneider Electric in the position of technical support for low- and medium-voltage projects and the design of busbar trunking systems.I'm highly specialized in the design of LV/MV switchgear and low-voltage, high-power busbar trunking (<6300A) in substations, commercial buildings and industry facilities. I'm also a professional in AutoCAD programming.
Profile: Edvard Csanyi
Will love to read the case study of harmonic resonance and mitigation in power factor correction at an industrial facility article
Thank you for the understanding