
Estimated Study Time: 21 minutes
The quality of the electrical energy
The quality of electrical energy seems to be very popular nowadays. It may be affected either by events that occur on the distribution systems (switching, lightning, etc.) or by the use made of the electricity when for example certain loads create significant variations in the current consumption (switching on) or alter the waveform (harmonics).
 14 disturbance types that mess up power quality and 50/60 Hz sinusoidal signal
The quality of the electricity supply is the subject of a European standard, EN 50160, which stipulates the permissible limits of fourteen values or phenomena characterizing or affecting the 50/60 Hz sinusoidal signal. Based on a statistical approach, it is designed to ensure a certain level of quality during normal operation.
- Signal frequency
- Amplitude of the supply voltage
- Slow voltage variations
- Fast supply voltage variations
- Flicker severity
- Voltage dips
- Short voltage interruptions
- Long voltage breaks
- Temporary overvoltages
- Transient (or pulse) overvoltages
- Voltage unbalance
- Harmonic voltages
- Interharmonic voltages
- Information signals transmitted on the system
1. Signal frequency
The nominal voltage frequency is 50 Hz with a tolerance of ±1% (i.e. 49.5 to 50.5 Hz) for 99.5% of each one-year period and +4 to -6% (i.e. 47 to 52 Hz) for the whole period.
This type of fluctuation is virtually nonexistent in public distribution systems in industrialized countries. In installations supplied by standalone sources (generator sets, inverters, etc.), different tolerance limits can be set, or regulation devices may even be necessary.
The same applies to systems that are not interconnected (for example, islands) where wider tolerances are permitted: ±2% for 99.5% of each week and ±15% for 100% of the time.
2. Amplitude of the supply voltage
The supply voltage represents the rms value measured at the delivery point. It is measured at a given moment and averaged over a time interval (typically 10 minutes).
The standard voltage for low voltage public systems in Europe is:
- 230 V between phases and neutral (400 V between phases) for three phase systems with neutral
- 230 V between phases for three phase systems without neutral
3. Slow voltage variations
Under normal operating conditions, the following slow voltage fluctuations are permitted over a period of one week: ±10% of the reference value (230 or 400 V), i.e. 207 to 253 V or 360 to 440 V for 95% of measurements, and -15% to +10% for 100% of measurements, i.e. 195 to 253 V and 340 to 440 V.
The supply voltage of the system can fluctuate daily, weekly, or seasonally as a result of significant variations in load in the system. Voltage regulation devices installed in transformer substations can limit these variations.
In addition, high power receivers such as welding stations, large motors, furnaces, and other energy-intensive installations may cause local voltage drops while they are in operation.
Power limits are generally set for motors supplied by a public distribution system. The solution may therefore be to increase the power of the source (reduction of its impedance and increase in its short-circuit power) or compensate for the reactive energy connected with one device, in particular, that is causing disturbance.
4. Fast supply voltage variations
These variations, which come mainly from currents drawn by high loads, should not exceed 5 to 10% of the nominal voltage. Recordings show that momentary reductions of 30% are totally possible when receivers such as motors or transformers are switched on.
5. Flicker severity
The intensity of the annoyance caused by flicker is defined by a UIE-CIE (International Union for Electricity Applications – International Commission on Illumination) measurement method.
It is evaluated as follows:
- Short term severity (Pst) measured over a period of ten minutes
- Long term severity (Plt) calculated based on a sequence of 12 Pst values over a two-hour period, according to the following formula:
Under normal operating conditions, for each one-week period, it is recommended that the long term flicker severity level Plt associated with voltage fluctuations is less than or equal to 1 for 95% of the time.
6. Voltage dips
These can be due to faults occurring at users’ installations, but they often result from troubles on the public distribution system. The numbers of these vary considerably according to local conditions, and they generally only last up to one second.
Standard EN 50160 does not specify the number, duration or depth of voltage dips. This characteristic could form the subject of a contractual agreement.
7. Short voltage interruptions
Short interruptions or ‘micro-breaks’ refer to when the value of the signal drops to 0 V or less than 1% of the nominal voltage. These generally last less than a second, although a break of 1 minute may still be considered as being short.
Micro-breaks and voltage dips are phenomena that are often random and unpredictable, and they may occur irregularly over time. It may be important to define contractually the maximum duration and threshold for a voltage dip to be considered as being a micro-break (for example a voltage < 40% of Un for less than 600 ms).
In most cases, only recordings can enable a decision on the accuracy of the phenomena to be made with certainty.
ITIC curves
Electronic and computing equipment is sensitive to voltage variations. the first installations, affected by apparently random faults, were historically the source of most Power Quality problems.
The creation of the information technology industry council curve (ITIC curve), has enabled a template to be defined, within which a voltage fault (dip or overvoltage) can be acceptable or unacceptable. Plotting the duration of an event as a function of the voltage in relation to the nominal supply voltage, these curves define the limits within which the device should continue to operate with no interruption or loss of data.
8. Long voltage breaks
These values are not quantified as they depend on totally chance elements. The frequency with which they occur is very variable and is dependent on the architecture of the distribution system or the exposure to climatic hazards.
Under normal operating conditions, the annual frequency of voltage interruptions of more than three minutes may be less than 10 or can reach as many as 50, depending on the region.
9. Temporary overvoltages
This type of fault can occur both on the distribution system and on the user’s installation. It can be devastating as the voltage supplied may reach a level that is dangerous for equipment.
Standard EN 50-160 does not set limits for these overvoltages. But on this point, it is essential, for the safety of people and installations, to choose equipment sized according to the standards (harmonized with IEC 60064-1) and tested for withstand to lightning impulses.
Insulation coordination in low voltage systems with regard to temporary overvoltages
Requirements of standard iec 60064-1:
- Sturdy basic insulation and supplementary insulation must withstand the following temporary overvoltages:
- Short duration temporary overvoltages, amplitude Un + 1200 V for t < 5s
- Long duration temporary overvoltages, amplitude Un + 250 V for t > 5s
(Un is the supply system nominal phase-neutral voltage to earth)
- Reinforced insulation must withstand values equal to double the overvoltage values.
10. Transient (or pulse) overvoltages
These phenomena are very variable. They are mainly due to lighting and switching on the system. Their rise time ranges from a few microseconds to a few milliseconds, so their frequency range is very wide, from a few kHz to several hundred kHz.
Protection against overvoltages requires the use of protection devices such as voltage surge protectors and the installation of equipment that is appropriate for its location in the installation.
Recording of overvoltage due to lightning strike
Lightning striking the system triggers overvoltages which are carried right to the users despite protection devices installed by the distributor. Unlike overhead systems, underground systems largely attenuate the shock wave.
11. Voltage unbalance
Voltage unbalance is caused by high power single phase loads. It causes negative current components which can trigger braking torques and temperature rises in rotating machines. It is advisable to divide the loads over the three phases as much as possible and to protect installations using appropriate detectors.
Under normal operating conditions, for each one-week period, 95% of the rms values of the negative sequence component of the supply voltage, averaged over ten minutes, must be between 0% and 2% of the positive sequence component.
In some regions where parts of system users’ installations have single phase connections or are connected between two phases, the unbalance can reach 3% at the three phase point of supply. If τi is the instantaneous unbalance value, the average rate τνm is defined by the equation:
where T = 10 minutes
Standard EN 50-160 only stipulates limits based on the negative sequence components of the voltage. Satisfactory approximations can be made using conventional measurements enabling the unbalance ratio between negative and positive components to be ascertained.
where U12 + U23 + U31 are the three phase-phase voltages.
Using symmetrical components
The symmetrical system corresponds to all the components (impedances, emf, back emf and loads) assumed to be symmetrical, i.e. identical on each phase. this must not be confused with balancing, which concerns the equality of the currents and voltages.
If there is a fault, overvoltage or short circuit affecting only one of the phases (which is the most common situation), the system becomes non-symmetrical and can then only be described by a real system, with separate V and I for each phase, representing the part concerned.
12. Harmonic voltages
When the characteristics of a distribution system are described, the harmonic distortion of the distributed voltage(s) is an important factor with regard to operating problems (sensitivity of electronic equipment) and reliability problems (ageing by heating of windings and conductors, breakdown of insulation of capacitors) that this type of disturbance can cause.
Harmonic currents are generated by devices whose supply consumes non-sinusoidal currents. Electronic, computer and office equipment, some lighting fittings, industrial welding equipment, inverters, power converters and numerous machines are the main causes.
Like harmonic currents, harmonic voltages can be broken down into sinusoidal voltages than can be described:
- Individually, according to their relative amplitude (Uh) in relation to the fundamental voltage Un, where h represents the harmonic order
- As a whole, i.e. according to the value of the total harmonic distortion THD, calculated using the following formula:
Under normal operating conditions 95% of the rms values of each harmonic voltage averaged over ten minutes and measured over a week must not exceed the values given in the table below.
Maximum harmonic distortion at the point of supply, expressed as a percentage of the fundamental voltage U1 according to IEC 61000-2-2.
Table 1 – Maximum harmonic distortion at the point of supply, expressed as a percentage of the fundamental voltage U1 according to IEC 61000-2-2
| Odd-order harmonics | Even-order harmonics | ||||
| Not multiples of 3 | Multiples of 3 | ||||
| Order h | Relative voltage (Un) | Order h | Relative voltage (Un) | Order h | Relative voltage (Un) |
| 5 | 6% | 3 | 5% | 2 | 2% |
| 7 | 5% | 9 | 1.5% | 4 | 1% |
| 11 | 3.5% | 15 | 0.5% | 6…24 | 0.5% |
| 13 | 3% | 21 | 0.5% | – | – |
| 17 | 2% | – | – | – | – |
| 19 | 1.5% | – | – | – | – |
| 23 | 1.5% | – | – | – | – |
| 25 | 1.5% | – | – | – | – |
In addition, total harmonic distortion of the voltage supplied (including all harmonics up to order 40) must not exceed 8% of the fundamental voltage (order 1).
To limit the harmonics, it may initially be necessary to revise the structure of the installation:
- Increase the cross-section of the neutral conductor
- Regroup the polluting loads (if necessary with source separation)
- Use of transformers with special windings (coupling of the 3rd order harmonic and its multiples on the neutral)
- Connection of sensitive equipment away from the polluting loads
- Connection of polluting loads to the source with the lowest impedance and as far upstream as possible. It is also necessary to check that the capacitor banks for compensating the power factor cannot start resonating (possible use of anti-harmonic inductances connected in series).
- The TN-C neutral earthing system must be avoided.
13. InterharmonIc voltages
This phenomenon refers to the frequencies located between the harmonics. These are caused by frequency inverters, uninterruptible power supplies, controlled rotating machines or arc devices. Their interaction can cause flicker phenomena, but it is above all with regard to information signals transmitted on the system that they must be identified and controlled.
14. Information signals transmitted on the system
In some countries, the public distribution system may be used by the distributor to transmit signals. The voltage value of the signals transmitted on the medium voltage distribution system (1 to 35 kV), averaged over 3s, must not exceed the values shown by the curve below over a period equal to 99% of one day.
The system is used by the distributor to transmit information signals which are superimposed over the voltage supplied in order to transmit information to users’ installations. However, the system must not be used to transmit information signals from private installations.
The frequencies of these signals vary from tens of hertz to several kilohertz, according to their function:
- Centralised remote control signals: superimposed sinusoidal voltage in the 110 Hz to 3000 Hz range
- Power line carrier signals: superimposed sinusoidal voltage in the 3 kHz to 148.5 kHz range
- Wave marking signals: short-time pulses (transients) superimposed at selected moments in the voltage wave.
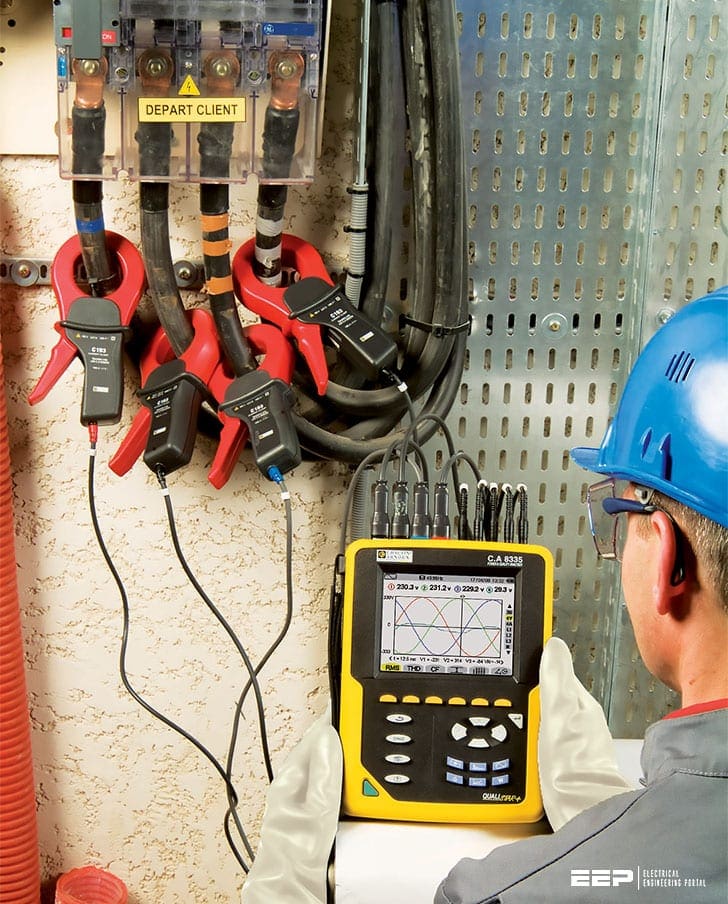
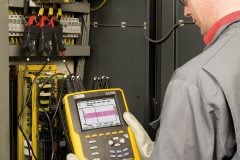
Example of network of analysers
There are many network analyzers that can can be used to obtain full readings for the electrical characteristics of networks, store them and transmit them remotely for use.
The choice of reactive power compensation or conditioning solutions will then be totally appropriate.
Source: Electrical energy supply by Legrand
Related electrical guides & articles


Edvard Csanyi
Hi, I'm an electrical engineer, programmer and founder of EEP - Electrical Engineering Portal. I worked twelve years at Schneider Electric in the position of technical support for low- and medium-voltage projects and the design of busbar trunking systems.I'm highly specialized in the design of LV/MV switchgear and low-voltage, high-power busbar trunking (<6300A) in substations, commercial buildings and industry facilities. I'm also a professional in AutoCAD programming.
Profile: Edvard Csanyi

The Article is certainly Good and informative. The way the PQ phenomenon affects the connected supply system components with every different PQ type of issue is still an missing information at large. Even today, the standards specified in these areas are inadequate and needs to address every issue separately with in depth analysis.
Definition of Power quality can change depending upon geographical area and weather conditions. It’s seems that there may be other power quality problems we encounters in our day to day life but, we couldn’t recognize or name them because we could not relate faults with the occurrences. A lots of research are required to understand the power quality issues. To mitigate PQ issues we need to make our machineries PQ ride through capabilities…
We should encourage this type of documents.