Simulating Software for VSR
To investigate the control strategy of Variable Shunt Reactors (VSR) with tap-changer, the best way is to take the advantages of modeling and simulation through computer software; in reality, it is impossible to connect VSR to the network and compare the results of several different experiments. In fact, it would be time-consuming and costly, along with lots of practical issues and problems in each experiment.
There is some powerful power system simulation software such as DIgSILENT Power Factory, PSS/E, Power World, EMTDC, and MATLAB SimPowerSystem Blockset. Every software has its own strong points and limitations. It is decided to start the DIgSILENT Power Factory work since it is a powerful tool for load flow studies. However, there is no possibility in DIgSILENT to investigate a new control strategy.
On the other hand, MATLAB is possible to access all the information and control the whole simulation process precisely; it is good for data gathering, manipulating different parameters of the system, and analyzing the results to extract an appropriate control strategy.
Afterward, the work continues with extracting a control strategy of the VSR through modeling and simulation using MATLAB SimPowerSystem/ Phasor Mode.
Investigation of Voltage Behaviour in DIgSILENT
Since one of these VSRs is currently connected to the grid in Norway’s transmission network, a part of this network is modeled in DIgSILENT. All data and parameters used for modeling are based on realistic data gathered from Statnett (Norway’s Transmission Grid Owner and Operator).
Appendix A shows the simulated model in DIgSILENT.
Figure 1 – The single line diagram showing part of Norway’s transmission network
There are four substations available in this area, namely Aurlanda 1, Aurlanda 2, Sima, and Dagali; among them, Aurlanda 1 (900MVA), Aurlanda 2 (150MVA), Sima (1300MVA) have generation units, while Dagali is an intermediate substation supplying 1350MW load out of this area. Figure 1 shows the interconnection between these substations and available loads and generation units. The rest of interconnected Norway’s transmission network is considered as an infinite busbar.
Figure 2 shows the Sima substation, which is part of the simulated network in DIgSILENT.
A 420kV, 120-200MVAr Variable Shunt Reactor is connected to this substation. Unfortunately, there is no real model for a VSR available in DIgSILENT. For this reason, due to simulating the connected VSR at Sima substation, one 120 MVAr fixed shunt reactor together with a 0-80MVAr switchable shunt reactor are used (Figure 2), and 5 seconds operating time is set for each tap to simulate a realistic tap-changing process.
Consequently, the frequency gets stable again; however, after 170 seconds, the load restoration coincides with some extra demand in these two areas, resulting in a 55% load increase in each area. The simulation is run for 300 seconds.
Figure 2 – The single line diagram model of Sima substation simulated in DIgSILENT
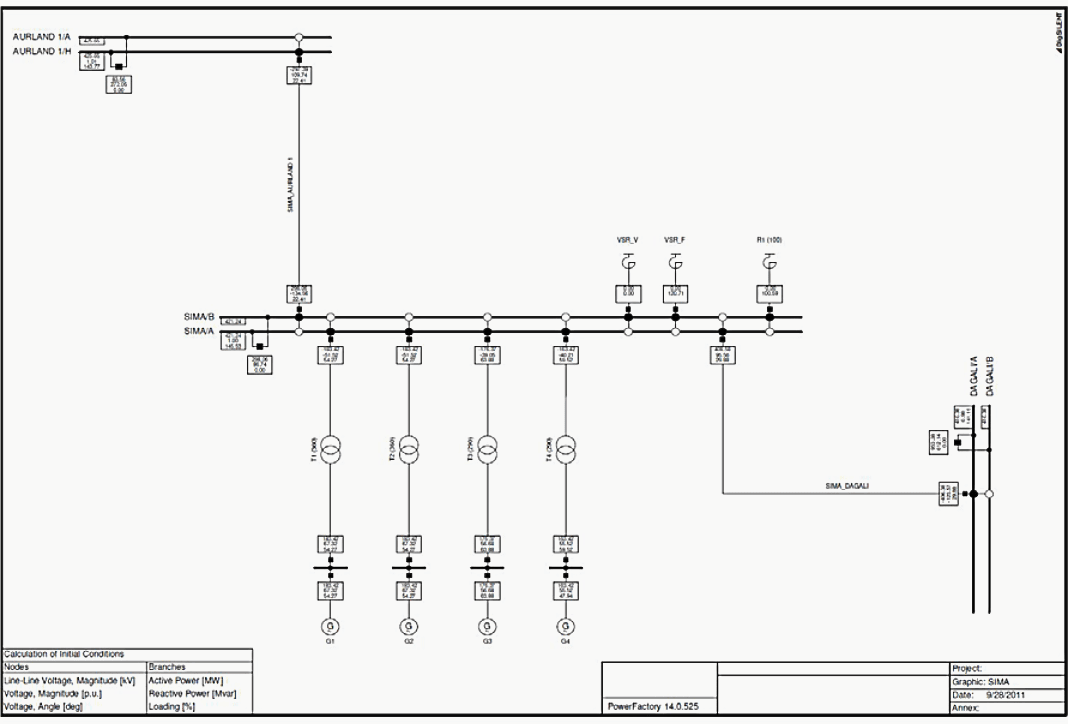
Figure 3 illustrates the voltage behavior at the Sima substation during the load scenario. As seen, the voltage is initially close to 1 per unit; after 50 seconds, because of load shedding, the voltage goes high immediately, and consequently, the VSR starts to step down the voltage when it exceeds the voltage dead-band. The tap changing process stops when the voltage goes back within the dead-band.
However, after few seconds (170 seconds from the beginning), the voltage drops suddenly due to a 55% load increase. At this time, the tap-changer starts to operate in the opposite direction to decrease the reactive power consumption of VSR and increase the voltage level again. Similarly, it stops when the voltage goes within the dead-band.
Figure 4 shows the voltage steps on a larger scale, while the VSR is tapping to step down the voltage. The sample step, which is specified with a circle in this figure, is magnified in Figure 5.
Figure 3 – The voltage behavior at Sima substation during simulated load scenario in DIgSILENT
Figure 4 – The voltage behavior at Sima substation during simulated load scenario in larger scale
Figure 5 – A close look at one voltage step and estimation of voltage step size
As seen in Figure 5, this single voltage step size is approximately 0.04% of the reference voltage, which is a small voltage variation equal to about 0.17 kV. Using a VSR in the network, excellent and smooth voltage regulation is achieved, and there is no voltage spike as expected.
However, as seen in Figure 5, the voltage step sizes are so small, which in practice could be a source of the problem to control this process. As a result, an impression of how small these voltage steps could be in practice is obtained by the simulations in DIgSILENT.
Following, the work continues in MATLAB to investigate possible control strategy of tap-change Variable Shunt Reactors.
| Title: | Control of variable shunt reactors with tap-changer through simulation of a power system – Mohammad Khorami at Department of Energy and Environment, Division of Electric Power Engineering, CHALMERS UNIVERSITY OF TECHNOLOGY |
| Format: | |
| Size: | 5.70 MB |
| Pages: | 93 |
| Download: | Right here | Video Courses | Membership | Download Updates |