Case studies with fault detection
Two case studies have been performed in order to investigate the performance of algorithms for fault detection and current limiting concepts on a model of a real power system. The modelling and simulation has been performed with EMTDC — a computer program for studying transient electrical problems.

The case studies were performed using two power systems, the first one based on standard values of rated system voltage, rated nominal load current, and rated short-circuit current as given by the IEC (denoted as the IEC case study), and the second case study was based on power system data from an electrical power distribution system at SSAB Oxel osund, Sweden (denoted as the SSAB case study).
Three different types of fault detection algorithms have been studied; one waveform algorithm, one model algorithm, and one instantaneous current algorithm.
IEC case study
The international standard IEC 60694 publish preferred ratings of switchgears and controlgears. For this case study the following ratings have been selected and power system impedances have been calculated based upon them:
- System voltage uh = 1 2 kV
- Nominal load (phase) current in = 630 A (measured at the load ZL in Figure 1)
- Short-circuit phase current in case of a solid three-phase fault ik = 40 kA
The time-constant of the power system (when no load is connected to the power system) was selected to 45 ms, corresponding to a power factor of cos ϕ = 0.0705. The power factor of the load was selected to cosϕ = 0.8, a typical value for common load types.

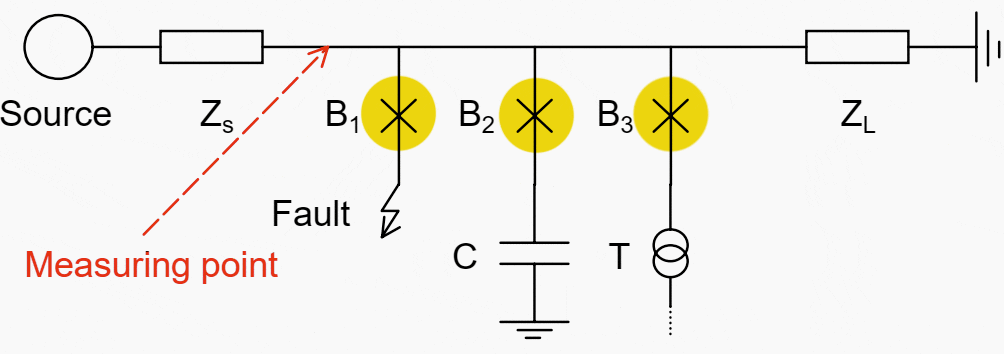
Figure 1 contains the single line diagram of the power system used in the IEC case study. The source is modelled as an infinite source, that is with no limits on active or reactive power production. The source impedance is ZS = 0.0122 + j × 0.173 Ω, which corresponds to a short-circuit current of 40 kARMS.
The load impedance was ZL = 8.79 + j × 6.44 Ω, which corresponds to a load current of 630 ARMS. Three circuit-breakers, B1, B2, and B3 espectively, were used to apply three power system transients. The first circuit-breaker was used to simulate faults imposed on the power system.
The second circuit-breaker was used to simulate capacitor energization, and the third circuit-breaker was used to simulate transformer Energization. The capacitor and transformer data was taken from data sheets of an actual power system. The capacitor was rated at 4.08 MVAr at 12 kV corresponding to a capacitance of 90.19 µF, and the transformer was rated at 10.2 MVA at 12 kV.
The capacitor and the transformer was implemented in EMTDC, using basic building blocks from a library with common power system components available within EMTDC. The transformer model is not just a ratio changer but saturation is also included. Since not all parameters of the actual transformer were known, standard values from the EMTDC power system component library were used.
Finally, a user defined component was used to implement three algorithms that were investigated with respect to speed of fault detection. The user defined component can be described by the block diagram of Figure 2.

Common considerations
The trigger level of the fault detection, i.e. a fault is detected when the current exceeds the trigger level, was selected to 3 times the RMS-value of the
nominal load current (a typical setting of an overcurrent relay is within 2.5 – 6 times the nominal load current according to an experienced relay protection engineer).
A simple data acquisition system consisting of a low-pass filter and a simplified A/D converter was added to the case study to be able to study some of the requirements and limitations of such a system. The measuring transformers however were implemented as ideal ratio-changers.
The input data to the algorithms (i.e. sampled values of voltage and current) was measured close to the source (to the right of ZS in Figure 1). Since the scope of this thesis is fast fault detection for power systems where current limitation or interruption before the first peak is required, the algorithms studied are intended to detect all faults within the power system.
In a power system with a traditional relay protection system, each feeder (the source, the capacitor, the transformer, and the load in Figure 1) would have had its own protection equipment6, but in a power system where current limiting is used it is likely that most faults have to be limited rapidly by a current diverter or a current limiter, which are typically located at the source or at a sectionalizing position.
There is however an advantage to perform measurements in several feeders, namely that the location of a fault might be easier to find.
| Title: | Fast fault detection for power distribution systems – Magnus Ohrstrom at Royal Institute of Technology, Department of Electrical Engineering, Stockholm |
| Format: | |
| Size: | |
| Pages: | 118 |
| Download: | Here 🔗 (Get Premium Membership) | Video Courses | Download Updates |


