Distribution network structures
This study focuses on the structure of MV (1 kV to 60 kV) and LV (1 – 999 V) networks. The distribution utilities that have been studied in this report are very heterogeneous in size (they operate from 1 to 100 distribution networks – HV/MV substations) and in structure.

Nevertheless, the group has managed to produce a summary of network structures of all utilities that highlights the differences and the similarities between them. We will show only those characteristics that will be useful for the discussion of fault management.
There is one major issue that differentiate the characteristics of a network – its urban or rural nature. Urban networks are usually short and underground, rural networks are usually long, but not necessarily overhead.
Two remarks should be made about this chapter:
- This document reflects the state of the art on network structures, and some changes might occur in the future.
- All the utilities contributing to this survey use MV networks without distribution of the neutral wire. Some conclusions don’t apply to networks of the “distributed neutral” kind (very common in the United
States and Canada).
Structure and operation
The structure of the MV networks is mainly meshable, so that feeders can be backfeed by adjacent lines. Urban networks are almost completely meshable, but that is not the case of rural networks for obvious reasons of cost. The percentage of rural networks that can be backfeed varies between 50% and 90% on the utilities studied.
LV networks are much less meshable than MV networks. Usually only some urban networks can be backfeed. The percentage varies between 0% and 30%.
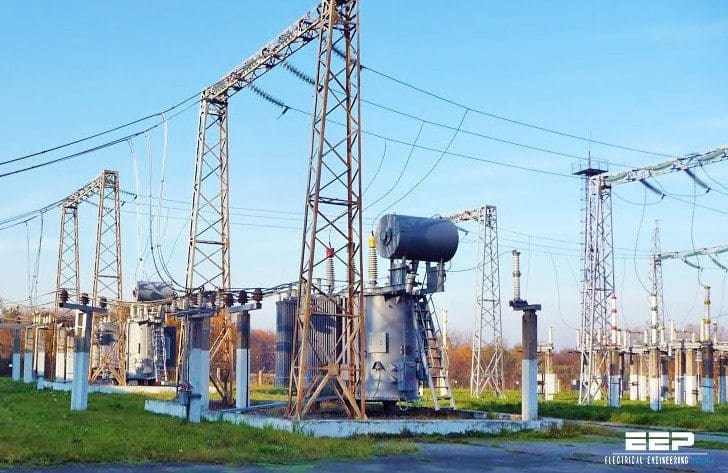
Primary substations
Primary substations (HV/MV substations) have generally from 1 to 4 power transformers. 2 transformers is the most typical value. The average number of MV feeders by substation varies between 4 and 20, most typical values being around 10.
Usually we find differences in the typical numbers of feeders of rural and urban substations, but the trends are different from one utility to another. The tendencies regarding the total number of primary substations are not same around Europe:
- In Finland the number is decreasing, in order to diminish the maintenance costs.
- In Austria the number is increasing in order to cope with new demand.
- In EDF and ENEL the number is increasing in order to improve the quality of supply.
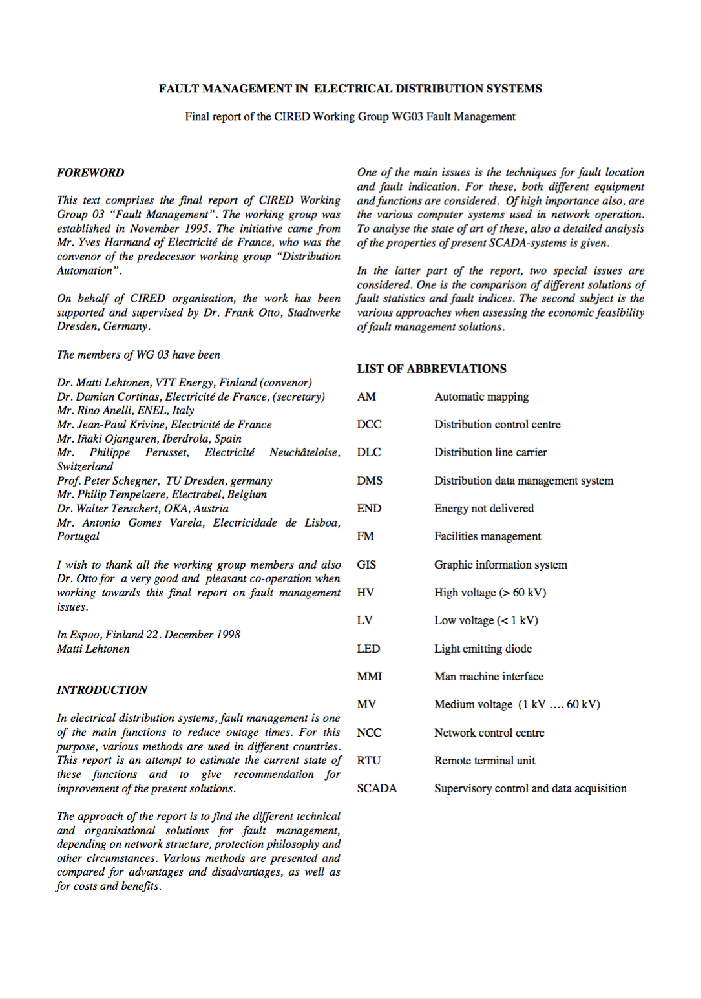
| Title: | Fault management in electrical distribution systems – Final report of the CIRED Working Group WG03 Fault Management |
| Format: | |
| Size: | 1.2 MB |
| Pages: | 113 |
| Download: | Right here | Video Courses | Membership | Download Updates |


