Abnormal (Fault) Conditions
Every power system established in the industry necessitates a protection strategy. Faults in a power system that go undetected can lead to dangerous circumstances, overheating of power devices, low or high system voltages, imbalanced conditions, and blackouts. The goal of this senior project is to create a power system safety strategy using the software Electric Transient Analyzer Program (ETAP).
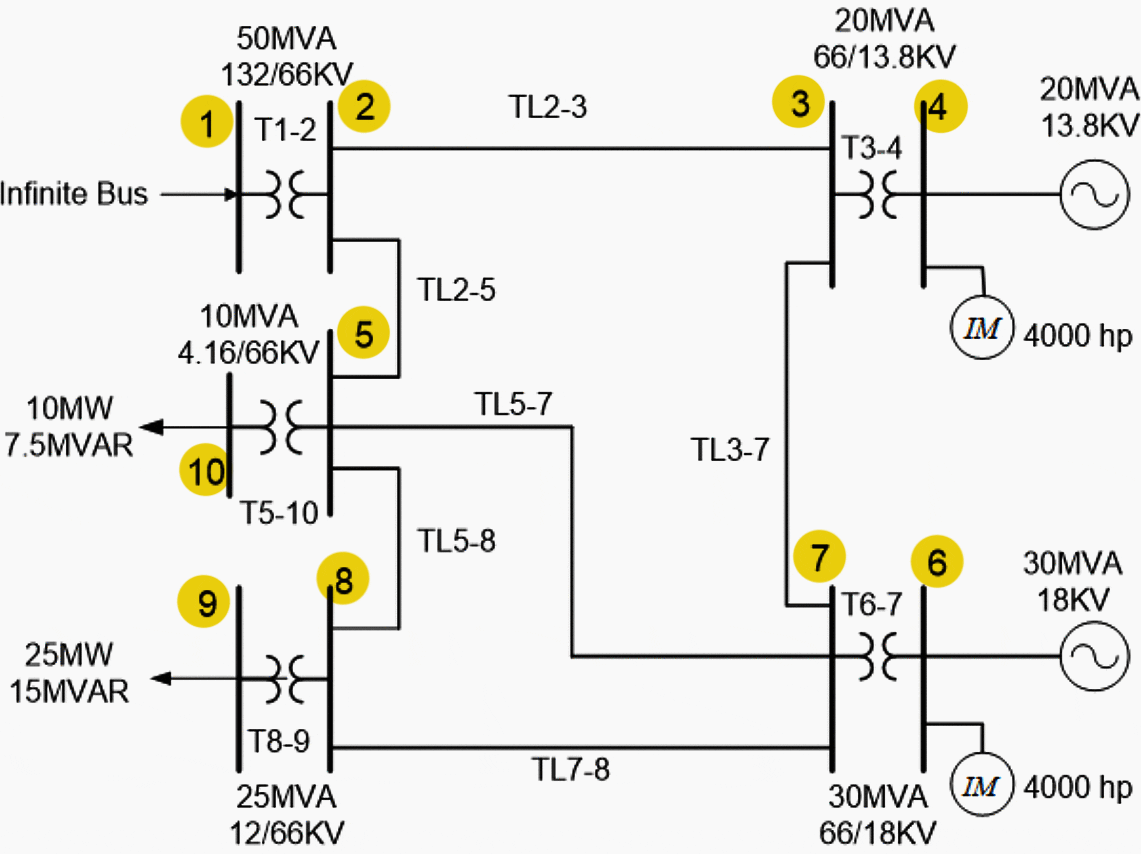
There are numerous ways for a fault to arise in a subjected network with ten buses, five transformers, two generators, two motors, and six transmission lines. Before the system is protected, the load flow and fault analysis are analyzed.
All components of the system are protected using methods such as differential and overcurrent protection. Without a proper power protection plan, any disturbance within the network has a chance of rendering the network inoperable.
This project illustrates the protection styles and techniques used by professional engineers in the field of power.
A protection strategy should be selective, cost-effective, dependable, and quick in order to discover and isolate errors. Security, selectivity, sensitivity, speed, and simplicity are the “5 S’s of protection that best express these ideas.
Figure 1 – Single-Line Diagram for the Power System
ETAP is the industry standard for power protection software, and it includes all of the features necessary to keep your network secure.
The power system I was tasked with protecting is shown in Figure 1. In this one line diagram, information about the system is displayed. Those values are used for all of the calculations throughout the entirety of the project, with any other values used being assumed.
Table 1 – Assumptions and Line Lengths for the Power System
| Line | TL2-3 | TL2-5 | TL5-7 | TL5-8 | TL7-8 | TL3-7 |
| Length (mi) | 90 | 30 | 50 | 30 | 60 | 60 |
Table 1 shows the transmission line lengths and whether the transformers of the system are Y connected or delta connected. The protection begins with load flow and fault analysis. Next, the transmission lines are protected using distance and overcurrent protection. The generators and transformers are then protected using differential and overcurrent protection.
The busbars are protected using busbar protection, while the motors and static loads are protected using locked rotor and overcurrent protection respectively. After the system is completely protected, the software is used to simulate the protection plans with the addition of relays.
If the correct connections aren’t known, all values could be affected by a factor of root 3.
Figure 3 – Network Construction in ETAP (click to zoom)
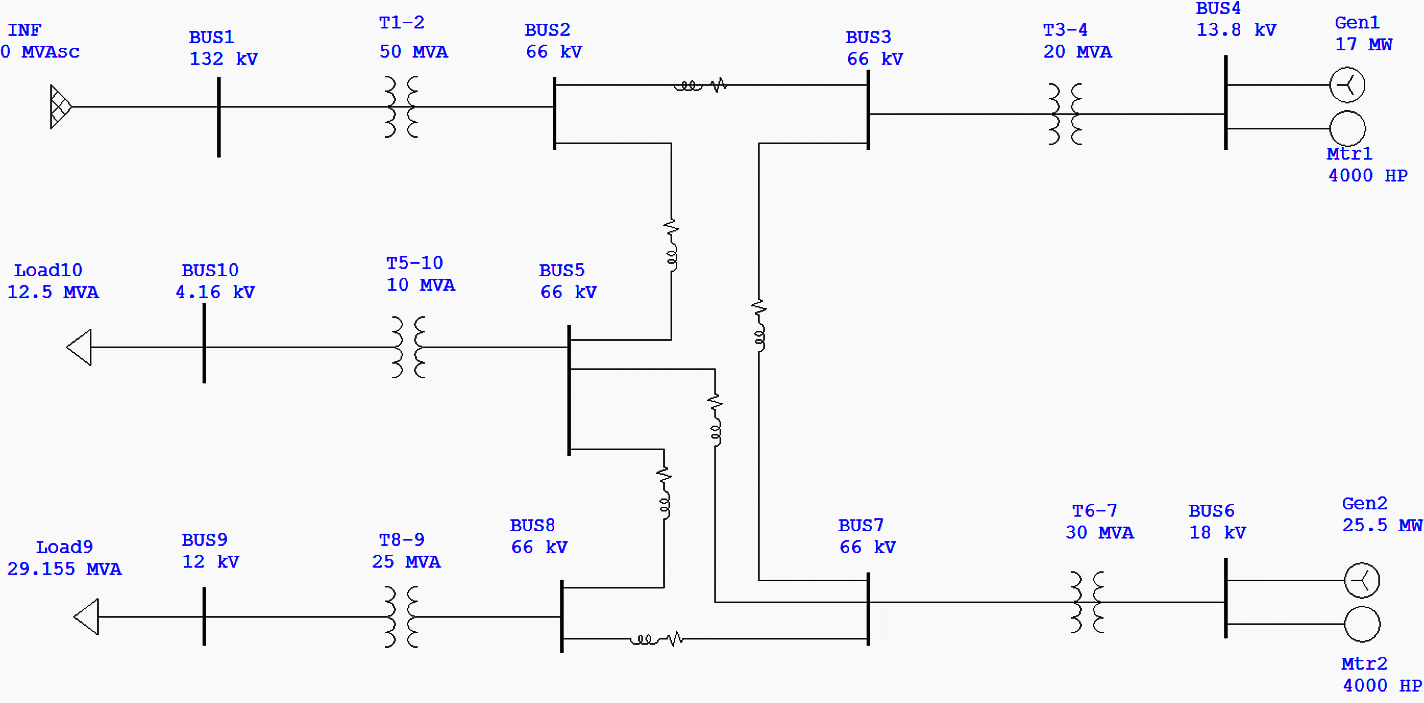
Network Construction in ETAP
Before any parts of the system could be protected, the system itself needed to be constructed in the software. The network assembled in ETAP is shown in Figure 2 and its zones of protection shown in Figure 3. The different protection zones overlap in the figure to show that no section of the system is unprotected from faults.
The chosen configuration of the transmission lines has a height of 70 ft. The phase conductor type was chosen as EPRI_M with the spacing between both A and B and B and C equal to 15 ft. With the spacing from A to C equal to 30 ft. The higher the voltage of the transmission line, the greater the height and conductor spacing should be.
The infinite bus also needed to have a short circuit MVA equal to 4200 in order for the system to operate.
Figure 3 – Protection Zones of the Power System (click to zoom)

Load Flow Analysis
In order to plan a full power system protection scheme for the given system, a load flow analysis is required. The analysis spots any problems with the system which must be corrected before any protection plan can commence. The load flow analysis shown in Figure 4 was completed using ETAP and constructed using the given instructions with default equipment settings.
After the initial load flow analysis, issues were found at both generators, as well as at buses 5, 8, 9, and 10. The parts of the network with problems are highlighted in red and those close to being a problem are highlighted in pink.
Figure 4 – Initial Load Flow Analysis (click to zoom)
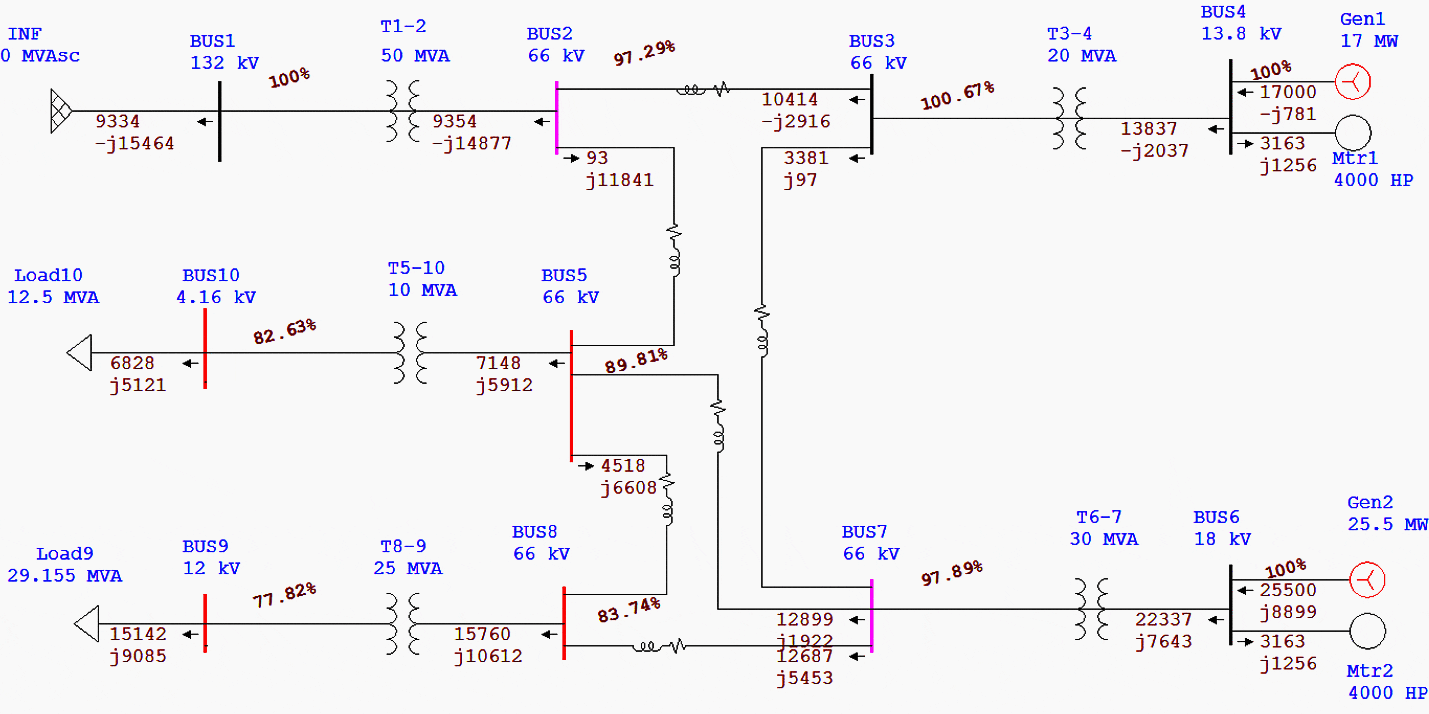
The system cannot operate with problems at its generators and buses. The method chosen to fix the problems was to add capacitive banks to the red buses to raise the voltage percentage up and the updated system is shown in Figure 5.
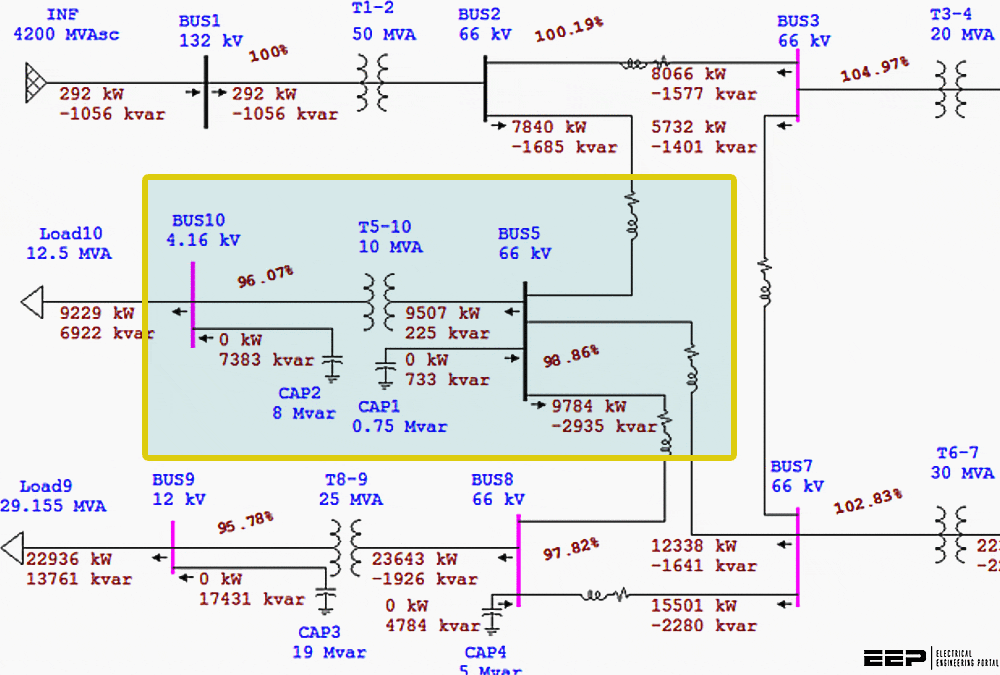
Figure 5 – ETAP System with Capacitors Added (click to zoom)
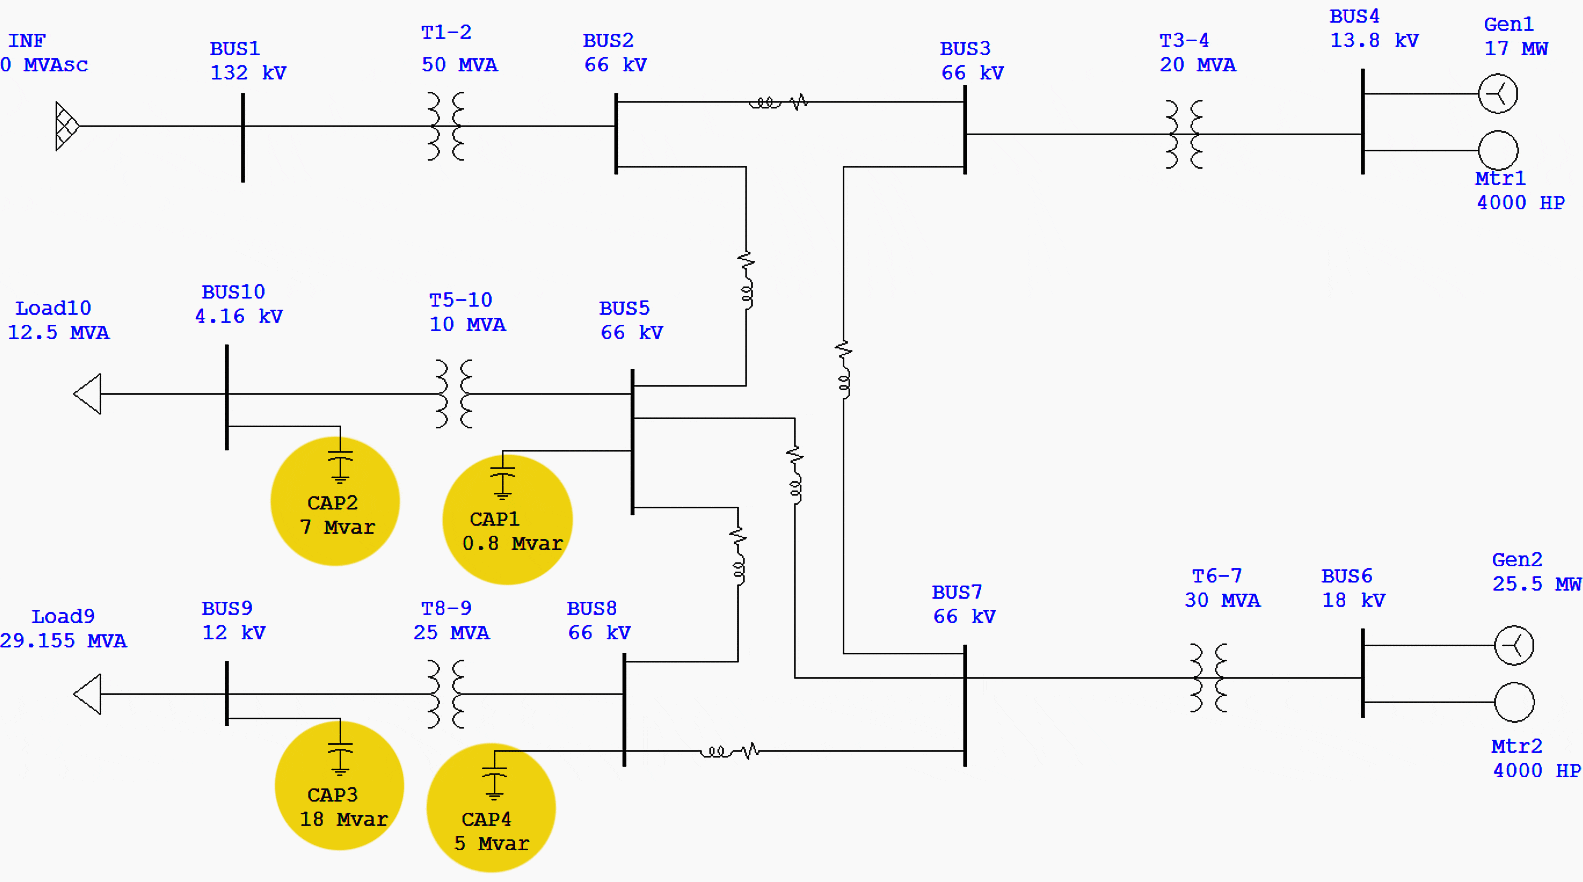
The way the MVAR values were chosen for the capacitors was by adding a synchronous generator to the bus and observing how much reactive power it was distributing to compensate for the under voltage bus. The added capacitors also helped remove any problems with the generators as well.
| Title: | Power protection study for a system with ten buses, five transformers, two generators and motors and six lines – Sean Hanna at California Polytechnic State University, San Luis Obispo |
| Format: | |
| Size: | 1.15 MB |
| Pages: | 31 |
| Download: | Here 🔗 (Get Premium Membership) | Video Courses | Download Updates |
Suggested Course – MV Switchgear Schematics Course: Tripping, Trip Circuit Supervision, Interlocking and Indication Circuits

