
Estimated Study Time: 24 minutes
Power supply & distribution in cement plants
Many young engineers consider cement plants pretty complicated because of their weird technology. The reason probably lies in the fact that you cannot understand all those technologies unless you worked in such a plant and saw all processes from scratch. However, this article will try to bring down a few essential production steps in the cement plant, as well as the power supply and distribution in cement plants.
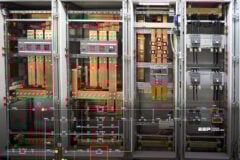
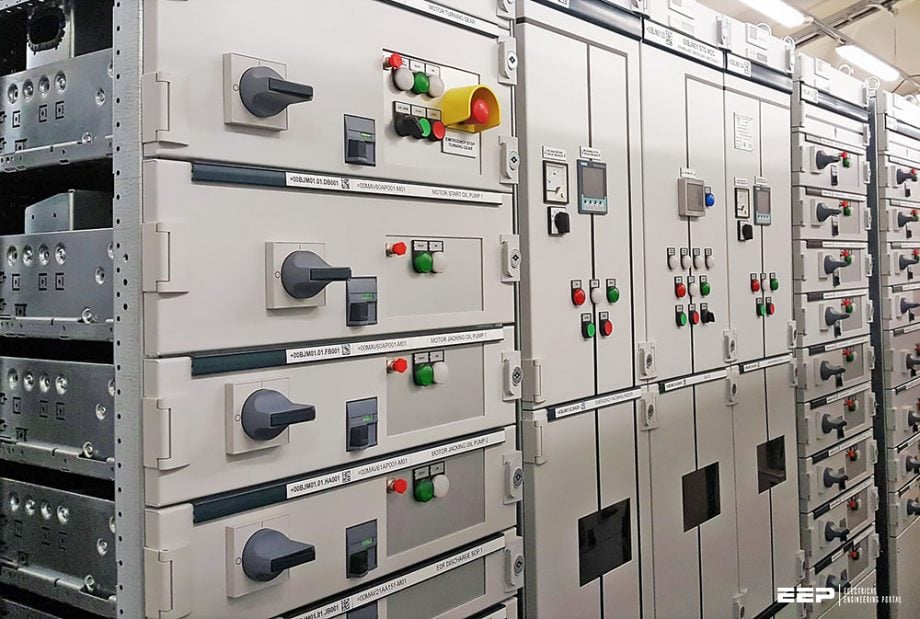 The essentials of electrical systems in cement plants (on photo: Low voltage motor control centres type 'Sivacon S8'; credit: elsta.pl)
Before we dive into details, note that this article assumes that you are already familiar with the basic terms of cement plant equipment and process. But, let’s first describe how the cement plant works after all.
So, let’s describe the six main operational phases:
Step #1
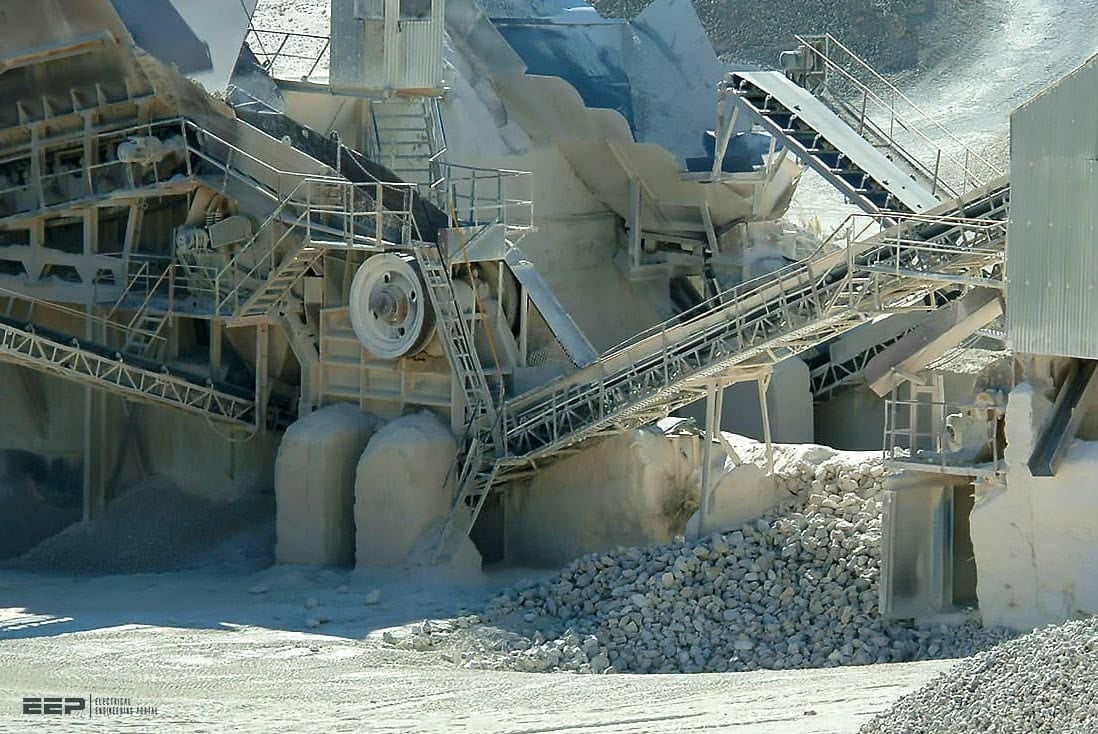
The most important raw materials for making cement are limestone, clay and marl. These are extracted from quarries by blasting or by ripping using heavy machinery. Wheel loaders and dumper trucks transport the raw materials to the crushing installations.
There the rock is broken down to roughly the size used in road metalling.
Step #2
The crushed material is transported into the raw material storage of the cement plant by conveyor-belts, cableways or railways and also in exceptional cases with trucks. Once there it is stored in blending beds and homogenised.
Step #3
The desired raw mix of crushed raw material and the additional components required for the type of cement, e.g. silica sand and iron ore, is prepared using metering devices.
Step #4
The burning of the raw meal at approx. 1,450°C is carried out in Lepol or preheater kilns that work by varying methods, the main difference being in the preparation and preheating of the kiln feed.
By chemical conversion, a process known as sintering, a new product is formed: clinker.
Step #5
After burning, the clinker is cooled down and stored in clinker silos. From there the clinker is conveyed to ball mills or roller presses, in which it is ground down to very fine cement, with the addition of gypsum and anhydrite, as well as other additives, depending on the use to which the cement is to be put.
Step #6
The finished cement is stored in separate silos, depending on type and strength class. From there it is mainly loaded in bulk form from terminals onto rail or road vehicles as well as onto ships.
- Power Distribution Design For Cement Plant
- Voltage and Frequency
- Power Distribution Grids Macro Scale
- Generation of Power
- Distribution System Within the Plant
- MV and LV Drives in a Section
- Synchronization of Grid and Captive Power
- Power Factor
- Designing Power Distribution System
- Electrical Power Tariff
1. Power distribution design for cement plant
Power distribution system of a cement plant begins with the substation of the grid where power is received and ends with individual drives and points of usage. It is a large network consisting of elements like: distribution transformers, MV/LV control panels, individual distribution switchboards and motor control centres (MCCs), switchgears for safety, regulation and metering of power used at various points, motors and their controlgear, power and control cables, lighting, earthing and other components of the system.
Design of the power distribution system is a specialised job and should therefore be entrusted to the specialists. In this technical article electrical systems in cement plant will be touched upon.
Variable speed motors can be either AC or DC with ratings ranging from fractional kws, for motors for dampers, valves etc., to several hundred kws for motors for fans. All these motors are to be supplied with electric power at voltage and frequency and type of circuit for which they are designed.
2. Voltage and Frequency
Depending on the country, frequency of power supply can be 50 or 60 cycles. Voltage of transmission could be as high as 222 KV or 132 KV for large capacities and 66 KV, 33 KV or 11 KV down the line depending on MVA capacity of the substation.
The voltage of generation itself would be say 6.6 KV. It is stepped up for transmission; longer the distance over which power is to be transmitted higher the voltage oftransmission to minimize losses in transit.
3. Power Distribution Grids Macro Scale
The whole system of distribution of power can be shown pictorially as a ‘grid‘ linking the several generating stations in a State. Grid ensures that power is assured to all consumers, even to remotest customers at all times. See Figure 3. Thus customers ‘a‘ and ‘b‘ can draw power from generating station 1, 2 or 3.
Grid within one State is connected to grids in another State and also to ‘national grid’.
4. Generation of Power
Bulk of the power is generated by Country Electricity Boards. It can be thermal power using coal as fuel; team is generated in boilers and drives turbines which in turn drive alternators or generators. Power is also generated in hydroelectric power stations by using water power. A balanced proportioning of generation between thermal and hydro power ensures availability of power in all circumstances in all seasons of the year.
Hydro power is obtained from water, which in turn depends on seasonal rain fall. When rainfall is scanty, quantity of water collected is affected and power generation is reduced. Hydro power generation is thus close to the source or storage of water.
4.1 Thermal Power Stations
Thermal power stations based on generating steam in boilers by burning coal depend on regular supply of coal. This coal can come from near or from far. Its supply may be affected by strikes in collieries or by bottlenecks in transport system, and sometimes also by fluctuations in the quality of coal supplied.
Automatic bus transfer scheme in thermal and nuclear power stations
4.2 Captive Power Plants
Generally, cement plants should install its own Power Plant to meet at least 40% of their requirements. A large number of captive power plants installed by cement industry have been d.g. sets; many large cement plants have however opted for coal based thermal power plants.
5. Distribution System Within the Plant
In a cement plant also there is a ‘mini grid‘ receiving power from main electricity grid and also from plant’s captive power plant. They have to work simultaneously and hence should be ‘synchronized’ when working in parallel, i.e., the voltage, frequency and phase must match.
Alternatively, captive power is used only to supply power to specific sections like kiln and one of the two major mills.
5.1 Ring Mains Within the Plant
The plant has what is known as a ‘ring main‘ which supplies grid power to load centers within the plant. If the captive power plant is large enough there can be two ring mains in parallel.
5.2 Medium Voltage Drives
Normally, drives of following machinery would be medium voltage motors:
- Main crusher
- Raw Mill
- Preheater fan
- Coal Mill
- Cement Mill
5.3 Variable Speed Drives (VSD)
In the last 25 years, variable speed drives (VSD) have been used more frequently in the cement industry. The main reason was to save energy in the production process. Generally speaking, variable speed motors would be used for electric motors listed in Table 1 below.
Table 1 – Variable Speed Drives
| No. | Motor for: | DC | AC |
| 1 | Crusher Feeder | ✔ | ✔ |
| Reclaimer drives | ✔ | ||
| 2 | Raw Mill Feeders | ✔ | ✔ |
| 3 | Raw Mill air separator | ✔ | |
| 4 | Preheater Fan | ✔ | ✔ |
| 5 | Prefeeders and Feeders for kiln Feed | ✔ | |
| 6 | Kiln | ✔ | |
| 7 | Grate Cooler grates | ✔ | |
| 8 | Cooler vent fan | ✔ | ✔ |
| 9 | Cooling air fans for at least first two compartments | ✔ | ✔ |
| 10 | Coal mill feeder | ✔ | |
| 11 | Feeders and prefeeders for fine coal for kiln and calciner | ✔ | |
| 12 | Feeders for cement mill | ✔ | ✔ |
| 13 | Separator for cement mill | ✔ | |
| 14 | Packing machine | ✔ |
6. MV and LV Drives in a Section
Thus some sections will have only LV supply and others both MV and LV supply and also DC drives. One option is to step down voltage from grid voltage for the total plant in one place and lead HT lines from it to respective sections in which MV motors are used. See Figure 4.
This arrangement required long 6.6 KV cables to various sections. Another option is to locate transformers near load centers i.e., near mills and kiln. See Figures 5 and 6.
Both arrangements have their own positive and negative points. Main objective should be to achieve continuity of supply of power of right quality (fluctuations in voltage and frequency and phase should be within permissible limits) and flexibility (supply can be either from grid or captive power) without interruption.
7. Synchronization of Grid and Captive Power
Even when parallel busbar system or ring system is not used, the grid supply and captive supply must synchronize and work in parallel or individually without disrupting power supply to any section of the plant.
8. Power Factor
Another important aspect is that of power factor. It’s important to know that:
- Induction motors work at varying lagging power factors depending on load.
- D.C. motors have unity p.f. on d.c. side.
- In case of synchronous induction motors, power factors can be altered between leading and lagging.
Useful Power:
Power factor as close to unity between 0.95 to 0.90 lagging is desirable to get maximum from power purchased from the grid station. Lower the power factor, less is the useful energy available and greater the losses.
When power factor is unity, useful power available is: V × A × 1/1000 = KVA = KW. This means that if power factor is say 0.80, useful power available is: V × A × 0.8/1000 = 0.8 VA KW
Power bills are based on kWh consumed and charges for maximum demand are on KVA.
8.1 Current Carried and Power Factor
Current required to be carried by cables varies according to power factor (PF). See Table 2.
Table 2 – Ratings of motors
| Power Factor | 10kW | 15kW | 25kW | 50kW | 100kW |
| Current in Amps | |||||
| 1 | 13.9 | 20.9 | 34.8 | 69.5 | 139 |
| 0.9 | 15.4 | 23.1 | 38.5 | 77 | 154 |
| 0.8 | 17.4 | 26.1 | 43.5 | 87 | 174 |
Say total load of above motors is 200 KW; total current at unity power factor would be 278 amps. If power factor were 0.85, the current would be 328 amps. All cables would draw correspondingly higher current right up to the substation.
It is therefore, important to correct power factor at levels of individual drives and also main power distribution panels.
8.2 Correction of Power Factor
Generally, correction of power factor is done by:
- Using individual capacitors for motors and by using ‘capacitor banks‘ in total sections.
- Using synchronous induction motors to correct overall power factor by running them on leading power factor.
Overall power factor can be improved to ~ 0.96 lagging. Current will reduce by 17 %. See Figure 7. Total power factor for the plant can be worked out in this fashion. If synchronous induction motors are not available, capacitor banks of suitable ratings and voltage are added in the circuit to obtain desired improved PF.
9. Designing Power Distribution System
One of the first things to be done in designing the distribution system is to work out the power to be drawn from the grid for the plant. This can be drawn on a broad basis starting from overall power consumption of similar cement plants.
For example if similar plants are consuming 95-100 kWh/ton of cement, it may be assumed that the new plant will also consume the same amount and total power to be drawn calculated as shown in subsequent paragraphs.
9.1 Working Requirements of Power Step by Step
Alternately the exercise may be done step by step. For this the first step is to arrive at departmental power consumption of each section in terms of power/ton of material handled. Then ‘convert’ it into clinker and then into power per ton of cement.
Take example of Raw mill Department.
- List all drives with their ratings.
- List power drawn at rated capacity.
- Work out for total section.
See Table 3.
Table 3 – Selecting working number of motors
| Number of motors | Drive rating [kW] | Power drawn as % of drive rating | Total actual power drawn [kW] |
| 4× | 1 | 0.8 | 3.2 |
| 3× | 5 | 0.8 | 12 |
| 4× | 60 | 0.8 | 48 |
| 4× | 2000 | 0.9 | 1800 |
| 4× | 500 | 0.85 | 425 |
| 4× | 200 | 0.8 | 160 |
| 10× | 20 | 0.8 | 160 |
| Total: | 2980 | 2608 |
- Total connected load is 2979 say 2980 kW
- Let material ground be 3000 tons in 20 hours.
- Therefore Tons/hour = 3000/20 = 150 tph.
- Average kWh/ton of material ground = 2608/150 = 174 kWh
- Power consumption per ton of clinker with a conversion ratio for consumption 1.55 : 1 = 17.4 x 1.55 = 27 kWh/ton
- Using 4% gypsum – 1 ton clinker = 1.04 tons of cement
- Therefore power consumption per ton of cement = ~26.0 kWh
In this manner list all sections of the plant. See Table 4.
Table 4 – Power consumption for whole plant
| Consumption | Unit/Tons Of material kWh | Material Conversion factor | Units/Ton clinker kWh | Units/Ton cement kWh |
| Quarrying | 0.5 | 2 | 1 | 0.96 |
| Crushing Raw Material | 1.5 | 1.5 | 3.25 | 2.16 |
| Grinding | 16 | 1.55 | 24.8 | 23.85 |
| Blending | 2 | 1.55 | 3.1 | 2.98 |
| Kiln Feed, Kiln Calciner | 0.5 | 1.65 | 0.825 | 0.79 |
| Preheater, Cooler | 25 | 1 | 25 | 24 |
| Coal Mill | 30 | 0.15 | 4.5 | 4.33 |
| Cement Mill | 35 | 1 | – | 35 |
| Packing | 2 | 1 | – | 2 |
| Water supply Lighting – Factory & Colony Other Utilities & Losses | 5 all together | |||
| Units: | 101.07 | |||
| Say: | 101.00 |
9.2 Margins to be Provided
For working out requirements of power to be drawn, it is desirable to add:
- 5-10% on actual consumption.
- Assume 10 %
- Design margin of 10% on rated capacity
- Therefore, specific power consumption = 111 kWh/ton
- Let rated capacity of plant = 3000 ton/day
- Hourly = 125 ton/hour
- With design margin = 137.5 ton/hour
- Therefore kw = 111 × 137.5 = 15260 KW
- This needs to be converted into KVA.
9.3 Load Factor
For conversion power factor and load factors are to be taken into account. Power factor has been dealt with above. Though it would be maintained at 0.95, for working out power to be procured, it may be taken as 0.9. Load factor is a usage factor; all machines do not run for all the 24 hours and at a constant load.
For cement plants where most sections work in three shifts, it is customary to take load factor as 80%. Thus if 15260 KW are required and load factor is 80%, rating to be installed would be 15260/0.8 = 19080 KW. Power required to be obtained in KVA at 0.9 PF = 21200 KVA.
9.4 Margins for Substation (Capacity and Expansion)
The substation capacity should allow for some margin for additions etc., that are not foreseen today. Therefore for the first phase, electrical demand would be fixed at with say a 25% margin. That would be 21000 × 1.25 = 26500 KVA say 26.5 MVA.
If duplication is imminent, substation should be designed for double capacity, i.e., incoming line should have capacity to deliver 53 MVA. In substation, transformers can be added phase-wise.
9.5 Selecting Transformers
In selecting transformers, it is a good idea to select two transformers in parallel rather than one. Transformers are generally loaded up to 70 to 80 % of their rating. In above case total load = 26.5 MVA. Total rating of transformer would be 26.5/0.7 = 38 MVA. It would be preferable to select two transformers of 19 MVA each or even 20 MVA each.
10. Electrical Power Tariff
Electrical tariff is in two/three parts :
- Energy consumption in $/kWh.
- Maximum demand costs in $/KVA/month.
- Any other duties as may be in force in each country from time to time.
Power is measured by energy meters installed by Grid Electricity Board in their Substation. Maximum demand is also recorded there. Energy meters must of course be calibrated periodically.
10.1 Maximum Demand
Many a time sudden overloads or simultaneous working of all sections can push up the maximum demand and power drawn will exceed contracted maximum demand. In such a case, fine is to be paid. In times of power cuts, contracted demand would not be utilized.
The impact of tariff on account of maximum demand however is generally about 10% of direct costs of energy.
Sources:
- Handbook for designing cement plants by S. P. Deolalkar
- How Cement Is Made by HeidelbergCement
- Sucess in Vietnam, Total plant solution for the Cam Pha cement plant by ABB
Related electrical guides & articles


Edvard Csanyi
Hi, I'm an electrical engineer, programmer and founder of EEP - Electrical Engineering Portal. I worked twelve years at Schneider Electric in the position of technical support for low- and medium-voltage projects and the design of busbar trunking systems.I'm highly specialized in the design of LV/MV switchgear and low-voltage, high-power busbar trunking (<6300A) in substations, commercial buildings and industry facilities. I'm also a professional in AutoCAD programming.
Profile: Edvard Csanyi

Thank you for the presentation would you kindly give insight on the graphite mine power system design
Sir,
Presentation was very clear to the points
Please provide pdf form for this.
Nicely presented. Sir I want this report in pdf form or any further related data if you have.
Regards,
Sir
I want this chapter in pdf format
Excellent presentation… starting with the basics, the flowchart of how cement is made, then on to the electrical technologies and applications. Perfect for “Cement Processing for Dummies” and for the cement savvy electrical engineers.
EXCELLENT MESSAGE
KEEP IT UP
Very neatly presented
thank you
Dear Sir,
Your thesis was very helpfull. Also required more deep study.