
Drying Out Electrical Equipment
Electricity and water do not form a happy partnership and so it is often necessary to “dry out” insulation. This may be done to remove surface moisture or perhaps to drive moisture from the internals of the insulation. Indeed some pieces of equipment have in-built heater coils which can be used for this purpose.
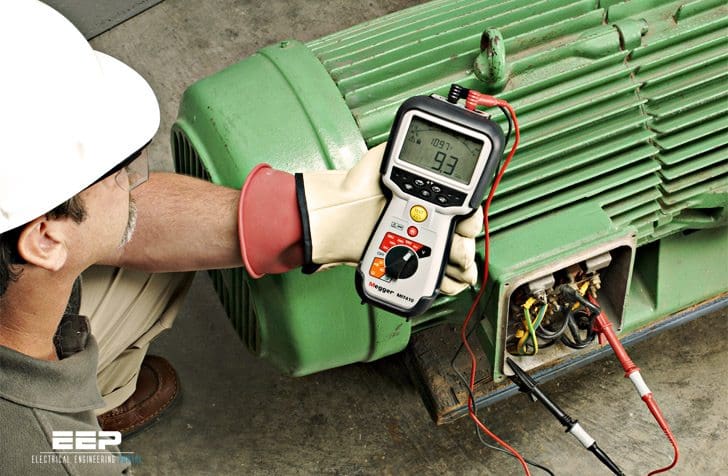 Electricity and water do not form a happy partnership, do they? (on photo: Megger MIT410 Insulation tester used for measuring insulation resistance of a motor)
However, several other methods are also available for drying electrical equipment. The most satisfactory solution to the problem involves placing the windings in an oven with suitable temperature control and proper air circulation.
Banks of infrared lamps may be used when this is not possible, or a suitable housing may be built around the machine, using steam coils or electric resistance type units for a source of heat. Openings must be provided for the free circulation of air as otherwise the expulsion of moisture would simply result in an increasing humidity inside the drying chamber.
Blowers may be used to increase the air movement.
Another method often used is to circulate low-voltage current through the windings. This method should not be used, however, until the insulation resistance has reached a value of at least 100 MΩ. The current should be limited to only a fraction of nameplate amperes, and a careful check must be maintained on maximum temperatures on the insulated parts.
Maximum drying temperatures on windings should not exceed 194° F (90° C) as measured by a thermometer.
This will prevent not only the rapid thermal deterioration of the insulation but damage from the high vapor pressures that would be obtained if steam were produced.
Flooded electric motor
If drying is required, records help determine when the insulation is moisture free. As an example of the importance of past readings, consider a motor that’s been flooded. After a cleanup, a spot reading with the Megger tester shows 15 MΩ. If past records showed the insulation resistance to run from 10 to 20 MΩ, the motor would be in good shape.
If, on the other hand, past records showed the normal resistance values to run from 100 to 150 MΩ, the operator would know that moisture was still present in the motor windings.
Often the resistance curve will take one or more sharp dips before leveling off or continuing to increase in a positive direction. This is due to moisture working out of the windings. When the machine is completely dried out, further work is required to remove any remaining dust. This may be done through the use of dry compressed air at pressure not exceeding 40 psi.
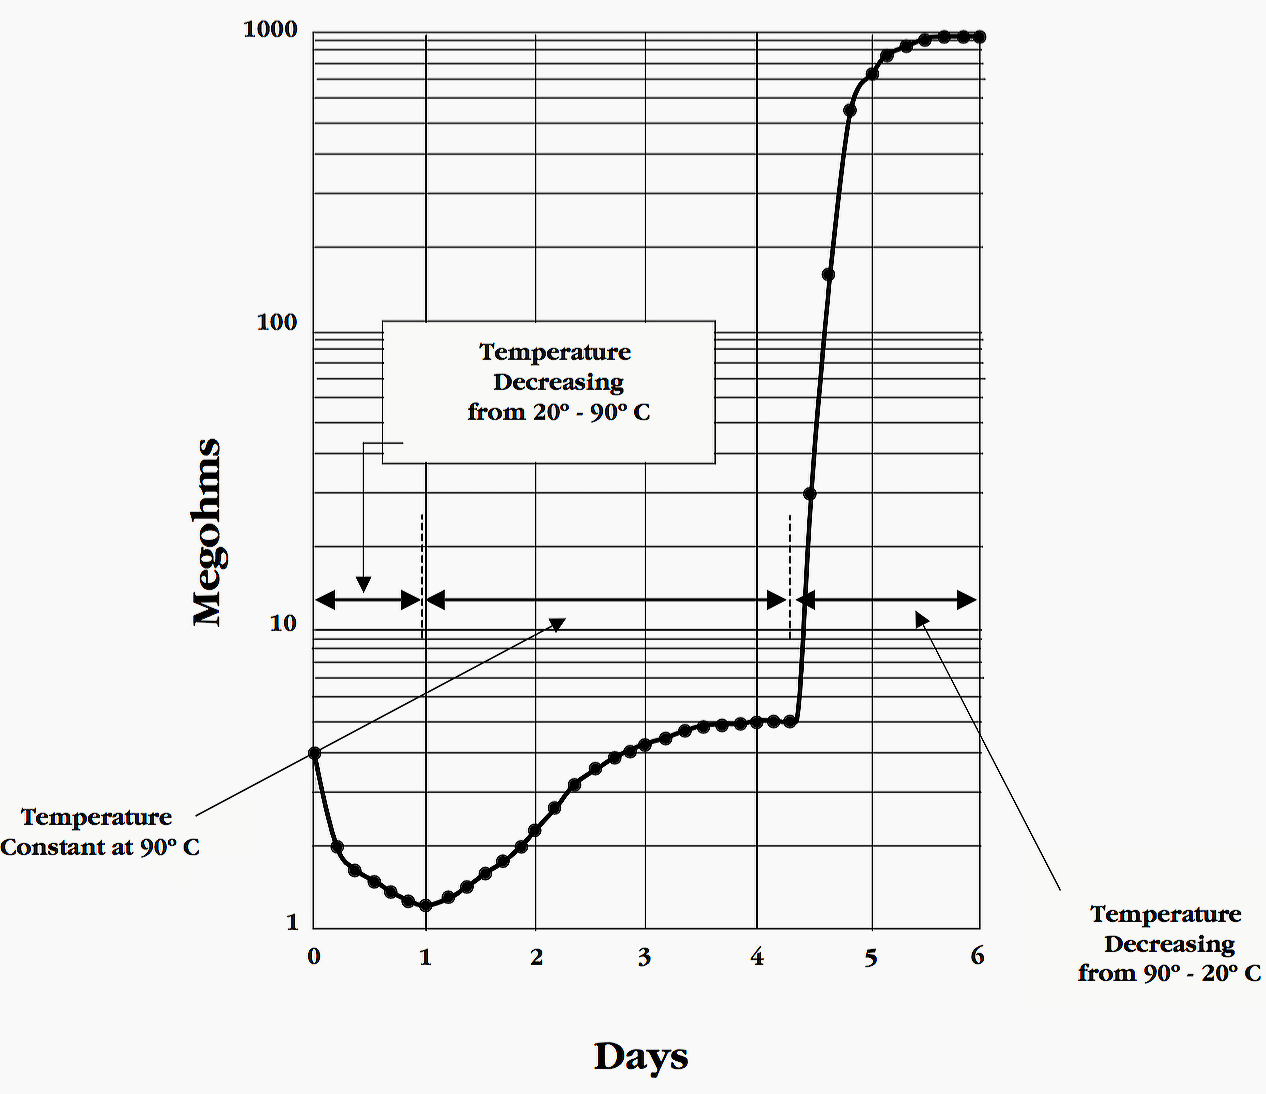
Figure 1 shows a typical drying-out curve for a DC motor armature, which shows how insulation resistance changes. During the first part of the run, the resistance decreases because of the higher temperature. Then it rises at a constant temperature as drying proceeds. Finally, it rises to a high value, as room temperature (20° C) is reached.
Therefore, the operator should be very careful before applying high voltages! More advanced insulation testers allow the test voltage to be set at anything from a low of 25 volts to a high of 5000 volts in 25-volt increments.
Reference // Mesuring insulation resistance by MEGGER


Thanks to the Author, The great & brave effort to enlighten with knowledge sharing to all at this platform.
Thanks with the best Regards
Dear Edvard,
The value of temperature shown on DAY 1 in the graph is written as “DECREASING FROM 20 – 90 D C”, whereas in actual it should be “INCREASING FROM 20 – 90 D C”. Necessary correction may please be made. The article enlightens us for taking all necessary care to avoid splashing of water over the motor.