
Estimated Study Time: 26 minutes
Quite complex, but very possible…
Not all existing electrical installations lack energy efficiency, but most of them do. Especially if they were built 15-20 years ago and older. Although it is generally acknowledged that substantial energy savings are possible in most existing installations, the process of achieving these savings is more complicated than it may seem. So, what could we do about it? This article will try to explain the process.
 Five actions to achieve excellent energy savings in old electrical installations (photo credit: electronicspecifier.com)
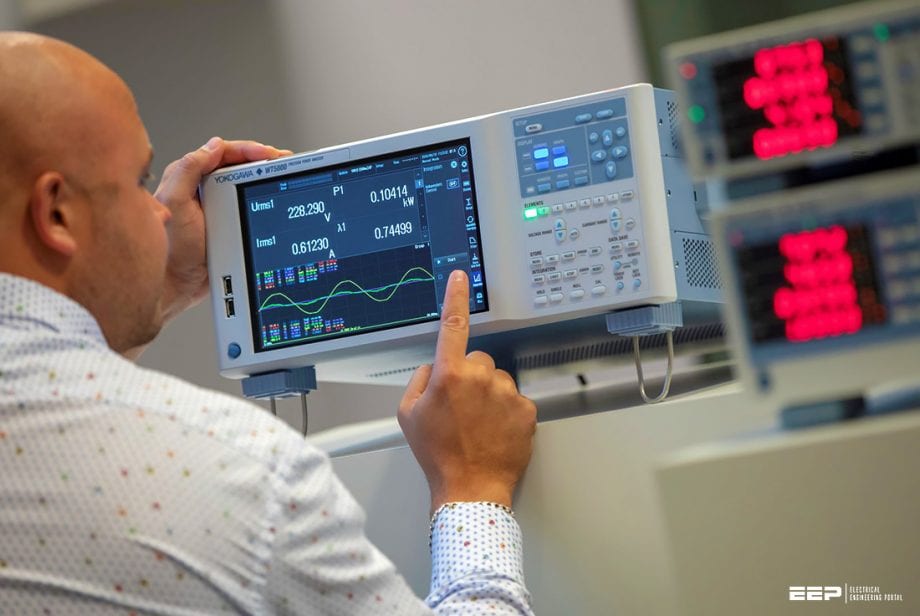
Suggesting and implementing alternative lower consumption solutions (motors, high-efficiency transformers, energy compensation, low consumption lighting, etc.) and also installing regulation and automation systems (electrical control units, PLCs, intelligent management, etc.) are investments that have to be validated and justified by diagnostics based on relevant sets of readings requiring the necessary measuring apparatus (metering, instrumentation, recording of consumptions and events, etc.).
The “energy efficiency project” methodology must leave nothing to chance.
- The diagnostic phase
- Collection of information and taking measurements
- Processing the data, consideration and identification of possibilities and improvement
- Implementing the improvement project
1. The diagnostic phase
The initial process consists of attempting to understand how the electricity is consumed, irrespective of whether or not this is the only source of energy.
What are the largest functions? How is the electricity used?
These parts are:
- Concrete, physical descriptive summary (the installation, the areas, the sources, the buildings, etc.) and
- Functional summary, which is often complex, as it is connected with human behaviour.
Its description must be intelligent, balanced and always prudent. We all forget to turn off a light sometimes. So while some types of behaviour may seem surprising, it is the cause we must investigate and not the consequence that must be pointed out.
1.1. Descriptive summary
The descriptive summary must first and foremost delineate and identify the main areas made up by the principal buildings (workshops, warehouses, storerooms, etc.) or main sectors of the entity in question which are intended on the whole for a main function: manufacturing, offices, warehouses, etc.
Ideally sources which give rise to energy metering should be superimposed over these areas, with for example a source item or better still a consumption history. Failing this, appropriate measuring apparatus must be available at least during the diagnostic phase.
The surface areas, number of floors, number of people present, and possibly other details such as the year of construction, and any element relating to the energy aspect (glazed areas, doors, structural components, etc.) must be specified in the descriptive summary.
Energy efficiency
Although it is right that heating and air conditioning account for a very large part of the energy consumption of buildings, in particular residential buildings (approximately 40% in Europe), other energy-consuming processes in the industrial field and also the commercial field may also be improved:
- Motors,
- Furnaces,
- Electrolysis systems,
- Lighting,
- IT,
- Refrigeration (in shops and warehouses),
- Hot water production,
- etc.
All the activities in each area must be assessed in terms of electrical consumption. The main activity and secondary activities must be distinguished. The secondary activities may often be less secondary than they seem: for example a cafeteria that consumes more energy than the kitchens.
The analysis of the energy company’s bills will give an overview of the energy consumption (active and reactive) and the share of the fixed items (standing charge and costs). In some cases, the customer also has access to a consumption history and can therefore ascertain the power consumption profile according to the time (measured in 10 min intervals) or even the season.
These two pieces of information will give an initial indication which will of course be general, but will already enable correlation with the operation of some high consumption items.
1.2. Functional summary: load items and their distribution
Unlike the first step which involved the description, the second step of the preparatory phase will consist of designating the main functions or load items and relating to each of them the devices or applications involved in that item.
Of course this is not the simplest approach, because it will be necessary to examine all the applications with sufficient precision, but without getting lost in too much detail.
Choices, sometimes arbitrary, must be made to select only high consumption applications or those which would a priori be wasteful.
A few preliminary measurements could be necessary at this stage in order to decide on the advantage of carrying out a more in-depth diagnosis of a particular function. The relative share of each of these load items must then be allocated to each of the previously defined main areas. Some load items may match one area fairly exactly, while for others the area identified may have numerous functions whose relative share must assessed.
This is usually the role of the power analysis prior to a project, but in the case of an existing installation, it is the measurement that will provide information on this exact share.
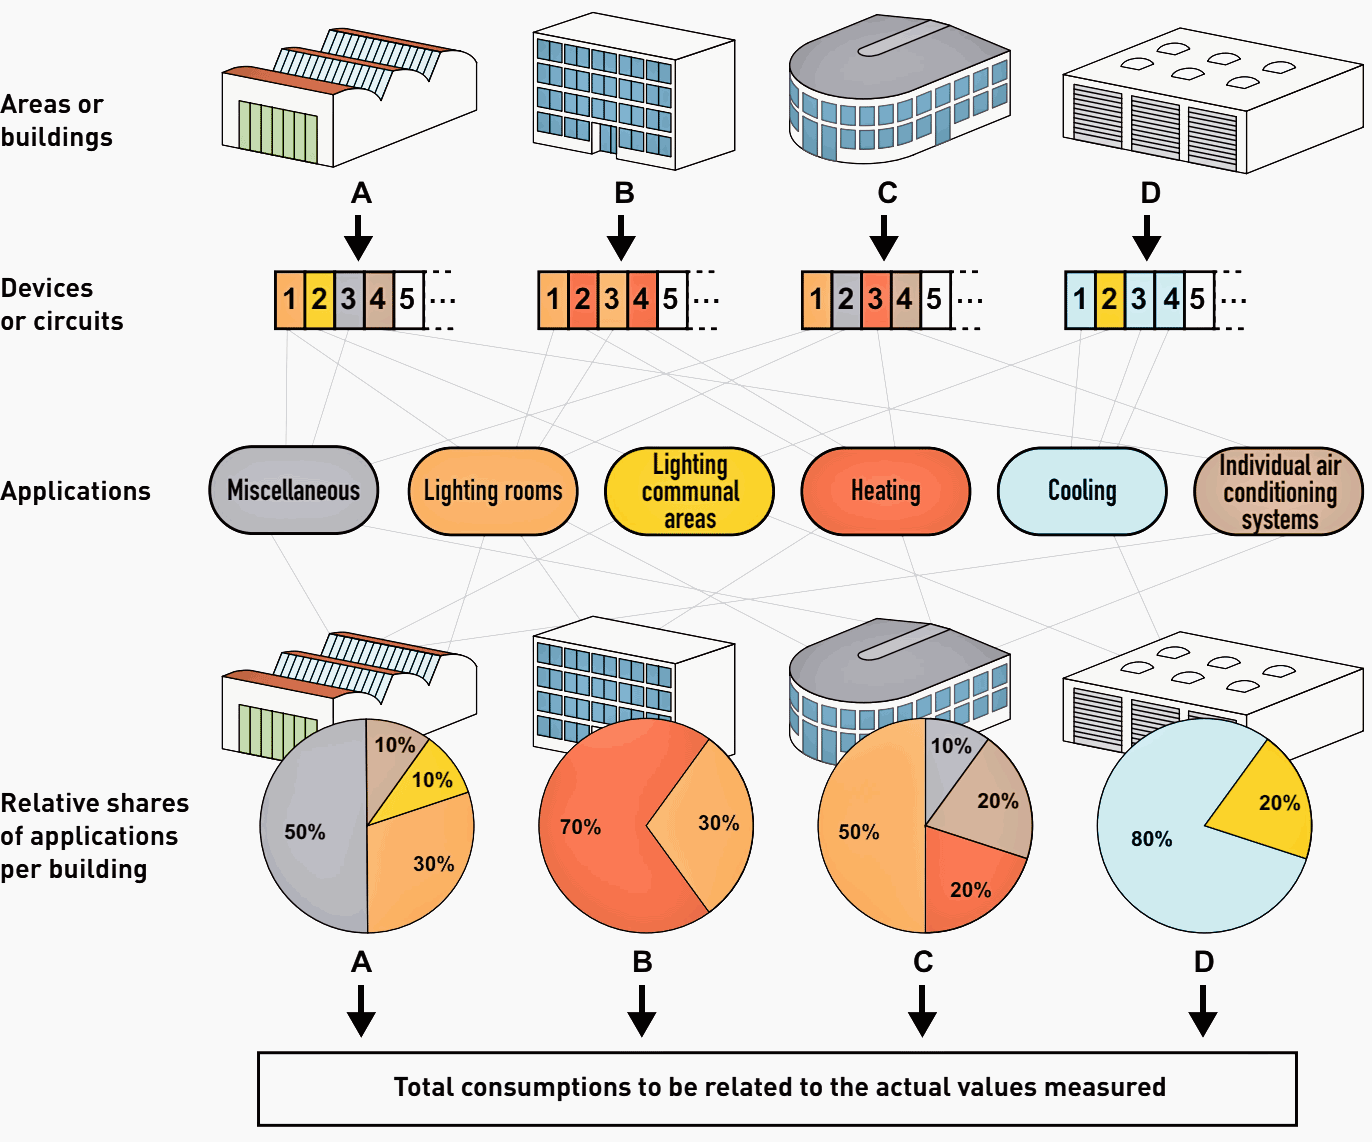
The process shown in the example in the block diagram on the previous page can be used to determine the relative shares of each of the functions by area or by building. These shares must be related to the actual measured consumptions (see block diagram). It is thus possible to establish relationships between the applications and the main consumptions.
In the example described, it is for example important to understand why building B has a relative heating consumption share of 70% whereas building C, with an identical surface area, only has a 20% relative share.
Of course, numerous other questions must also be asked:
Question № 1 – Comparison of the actual energy consumptions in kWh.
Question № 2 – Understanding of why individual air conditioning units are installed in this building.
Question № 3 – Is the solar gain perhaps much higher in building C? This could explain the lower heating demand but, as a counterpart, the cooling requirement.
At this stage in the considerations, consultation of the consumptions according to the times of year could be revealing.
Question № 4 – Should better use be made of the solar gain, which is useful in winter but inconvenient in summer?
Individual air conditioning units are certainly not the right answer. Deflectors, awnings, a centralised air conditioning system or even changes to the hours during which the premises are occupied are all hypotheses that should be explored.
Question № 5 – The assumption that a large part of the heat is generated by the lighting (50% of the consumption of building C) must be precisely quantified.
If all these questions do not provide satisfactory answers, it may be necessary to look for them in the characteristics of the buildings.
Question № 6 – Is the insulation of building B adequate? Numerous causes can be investigated: aren’t there abnormally high losses in the actual functioning of building B?
The doors opening onto the loading bays are often open. It could be possible to consider asking users to close them, but if this has to be said ten times a day, the effectiveness of the measure is likely to be uncertain. Other solutions such as air curtains or automatic closing systems should therefore be considered.
Although evidence may appear on simple reading of the available consumption figures, it must be remembered that many points will only appear when additional information is collected: operating cycles, human occupation, local climatology, characteristics of the buildings, etc. which must be cross-referenced with the measurements taken on-site.
The exact relative share of the functions/applications described in this diagram cannot generally be completed until after measurements have been taken.
2. Collection of information and taking measurements
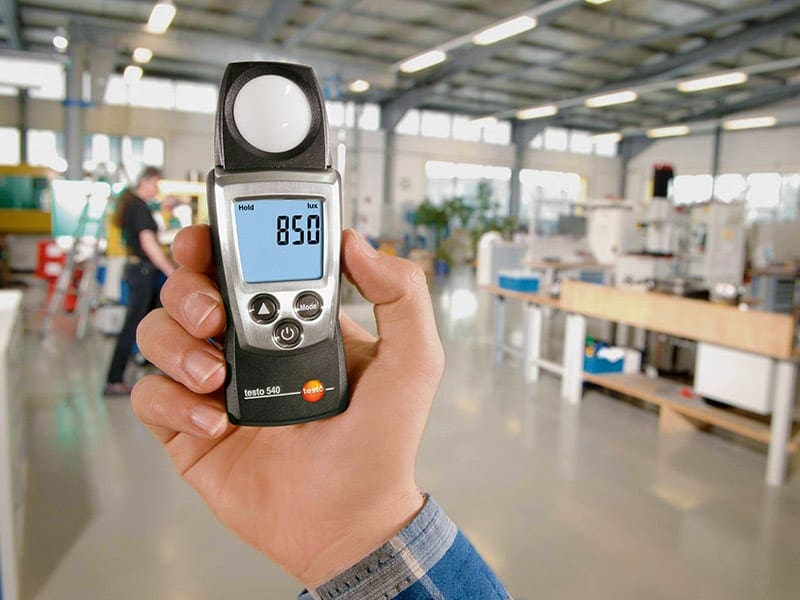
2.1. Luxmeter
The lighting on constant power light sources is measured using a luxmeter. The lamp meter is a device that also has memory functions. It is installed in the immediate vicinity of each point of light to be evaluated. It has an optical sensor that records the periods during which the lighting is operational.
When using this, the power of the lighting equipment (assumed to be constant throughout the whole measurement period) must also be measured.
The specific energy consumptions can be ascertained by multiplying the power by the recorded durations.
2.2. Presence meter
The presence meter is a very compact standalone electronic recorder fitted with an infrared detection module. Each time someone enters the sensor’s detection area the event will be stored in the memory: detection start and end date and time.
This device provides precise information on the traffic and human presence in a given area.
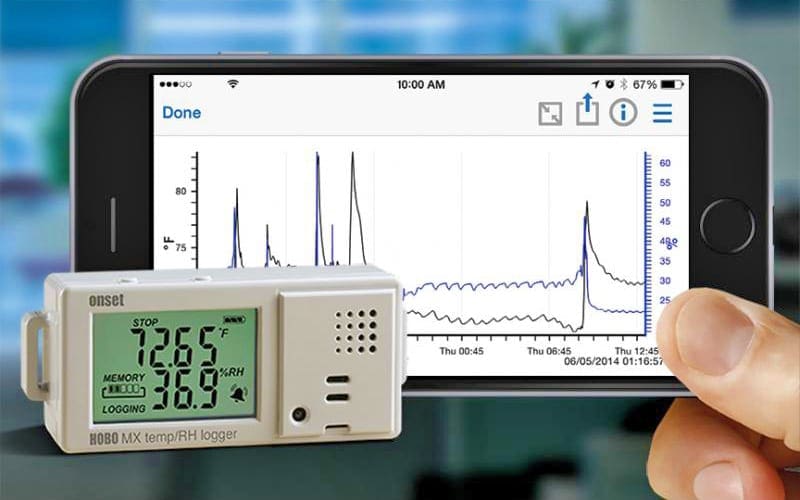
2.3. Temperature recorder or multichannel acquisition unit
Small standalone thermometers are available that carry out repetitive measurements (for example, every two minutes) and calculate the average per period. The values are stored in the memory.
More sophisticated devices such as measurement control units can acquire a wide variety of data, including the temperature, over hundreds of points. Their installation and connection are more complicated, but some can now be interfaced on a local area network, Internet or even the smartphone.
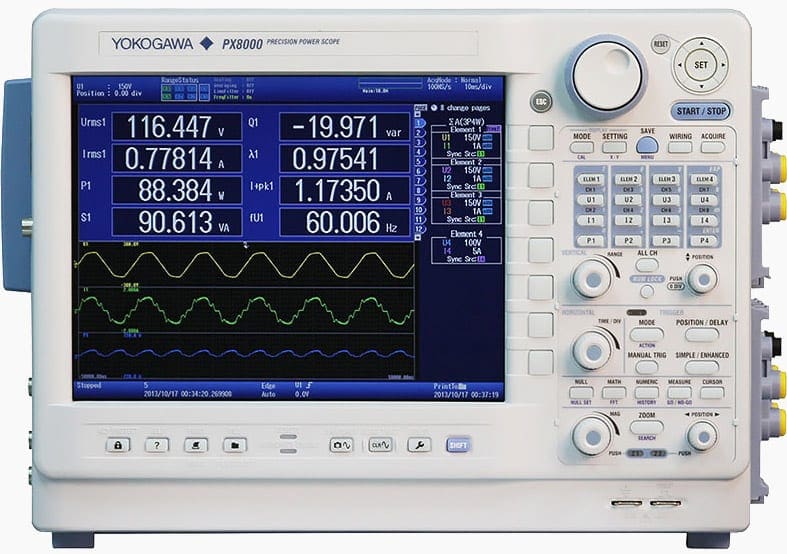
2.4. Wattmeter
This device is used for measuring power. Current digital models can be used to access all values: P, Q, S, U; I, cos ϕ, PF (power factor), etc., and even harmonic and frequency values. Some even carry out direct energy calculations by integrating the measurement time.
These are referred to as power analysers.
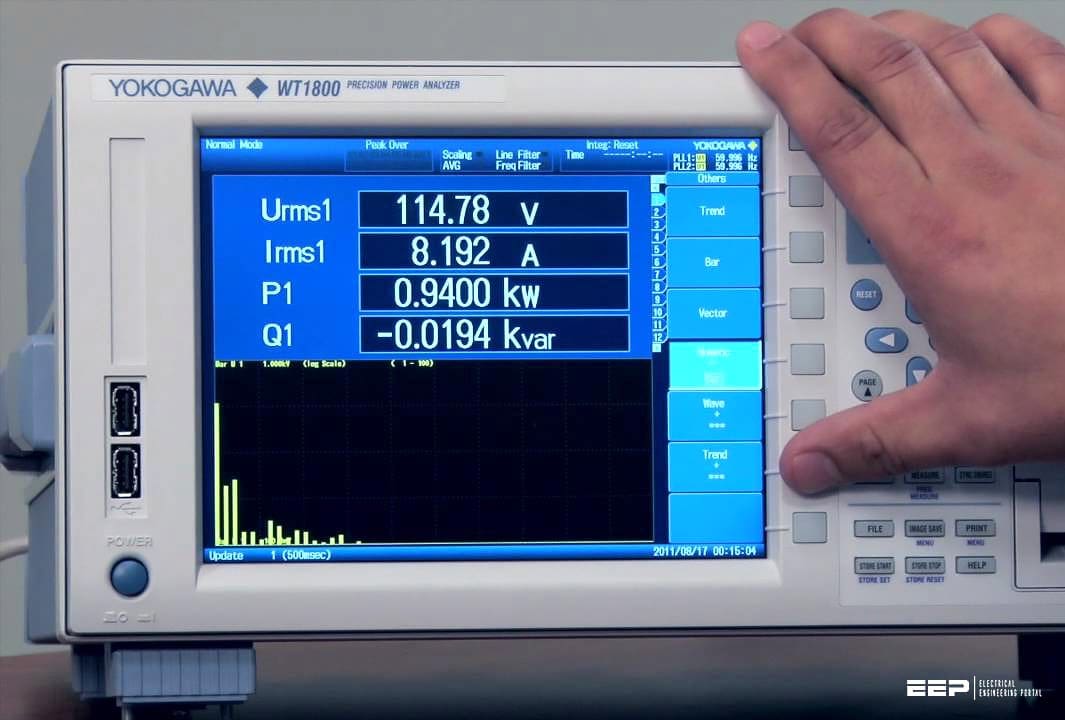
2.5. Recording analyser
This performs some or all of the functions of the power analyser but can record values measured over long periods.
It produces histograms which are very useful since, as well as giving details of instantaneous values, they can be used to establish precise relationships between consumption and events.
3. Processing the data, consideration and identification of possibilities and improvement
The collection of large quantities of measurements may cause dispersion and considerable difficulty of interpretation. Paradoxically the huge data acquisition capacities of today’s devices mean that it is not always easy to sort out what is relevant and adequate.
For lighting, power per unit of surface area could be considered (see example), or daytime/night-time ratio. Different buildings could also be compared on this basis.
Table 1 – Example of analysis for lighting
| Areas in building C | Specific power during the day (W/m²) | Specific power during the night (W/m²) |
| Assembly workshop | 30 | 0 |
| Corridors and staircases | 15 | 5 |
| Cloakrooms | 7 | 0 |
| Office on 1st floor | 22 | 15 |
| IT | 40 | 40 |
| Laboratory | 25 | 10 |
| Offices on 2nd floor | 28 | 0 |
| Basement warehouse | 62 | 50 |
| Access to the outside | 2 | 2 |
The presentation of consumption according to periods of occupation is often very useful and could be a quick source of savings. In other cases, such as heating, a seasonal profile would be useful for comparing potential alternative resources such as solar energy.
Without going into detail in this table, several striking anachronisms can be quickly seen:
- Areas whose consumptions are very different while their theoretical requirements are identical,
- Areas that consume a great deal of energy for lighting while there are almost no humans present, and
- Areas where lights are not switched off at night when there is no reason for them to be kept on.
Apart from the potential savings, this type of presentation also confirms certain shortcomings. The external entry lighting, apart from operating in full daylight, also has the drawback of being ineffective. The very low power allotted to it confirms this.
There are many possible interpretations of the results. The ability to organise the project and its chances of success will depend on selecting the correct interpretation.
3.1 Questioning phase
Four essential questions to be asked:
- Is it justified for it to operate in this time slot?
- Is there an alternative solution that uses less energy?
- Is it absolutely essential?
- Is it possible to change the opening times?
One may imagine that it would therefore be possible to fulfil the same requirements with much less energy, and with a lower power demand. This very innovative approach has already been successfully applied to other types of buildings.
The consideration and questioning phase, which must lead to the examination of existing information, is essential.
4. Implementing the improvement project
Following on logically from the diagnostic phase, the implementation phase will be based on the analysis report whose relevance and readability will have a significant influence on the decisions that are taken on actions.
Download an example of building energy monitoring and analysis report:
4.1. Possible actions
At this stage, the decision can be taken to either do nothing or to undertake improvement work. There are often as many possibilities for improvement as there is information collected, to such a point that there is a real risk of trying undertake too many things at once, just as there is a risk of confusion over the expected effectiveness of an action.
It is therefore advisable to give an overall picture of the achievable improvement by subject and the associated cost involved.
Table 2 – Example of presentation
| Possible actions | Saving (1) | Cost (2) |
| Raising staff awareness | 1 to 3% | Low 1,000 € |
| Changes to opening times | 2 to 6% | Low 1,500 € |
| Optimisation of operating modes | 5% | Negligible |
| Improvement of regulation | 5 to 12% | Average 15,000 € |
| High efficiency receivers and applications (motors, furnaces, etc.) | 15 to 20% | High 40,000 € |
| Changing heating boilers | 8 to 15% | High 180,000 € |
| Drawing up a lighting plan | 10 to 20% | Not costed (totally separate project) |
| Energy management (measurement, management, forecasting, purchase, etc.) | 10 to 15% | Average 10,000 € |
| Improvement of electrical quality (power factor, harmonics) | 2% | Average 8,000 € |
(1) In comparison with a reference consumption which is to be specified (for example, average over the last 3 years)
(2) Low, medium or high, or if possible a more precise value
Decisions can then be taken on various actions. They must be connected with a reference subject. Plainly, low cost operations should be undertaken quickly, even if the resulting savings are small.
4.2 A few common sense rules
Apart from talking about new or renewable sources, positive energy or fantastic efficiency levels, we must not forget that saving means first and foremost not losing.
The “war on waste” must go on all year round…
- Putting an end to unnecessary consumption: too much heating or lighting, poor insulation, etc.
- Finding and correcting malfunctions: poor regulation, over-ventilation, inappropriate cycles, etc.
- Identifying unsuspected consumption: keeping an eye on devices and also permanent supplies of certain receivers (telephony, IT, etc.), UPS, etc.
- Only operating equipment when needed: lowering or turning off heating during periods when premises are not occupied, management and control of lighting, etc.
- Replacing antiquated equipment with modern, more economical devices: even if this involves going down a more costly route, as it is generally the most profitable.Heating technologies, whatever the energy source, have progressed a great deal. High-efficiency motors provide significant operational savings. The latest generation lighting systems provide better lighting and cost less.
- Making existing equipment more cost-effective: some processes can for example be used better in order to reduce their operating times.
Why is electric motor efficiency so important?
Here ABB explains the importance of high motor efficiency and MEPS (Minimum Energy Performance Standards), which sets the mandatory minimum efficiency levels for electric motors.
4.3. Recommendation and presentation of actions
The recommended actions should be presented with a precise description of the application in question and the reference subject as just mentioned, supporting an energy cost justification based on the measurement phase, and proposing a replacement or improvement solution. The investment cost, and if required the maintenance cost, together with the resulting potential energy savings and cost savings must be presented in the form of a financial analysis with a cost-benefit calculation.
If the benefits and savings are identified, specific conditions for success may be specified. These may be for example:
- The agreement of the staff (provide the appropriate information),
- Informing customers (opening times),
- Equipment requirements (direct high voltage power supply for very large motors, etc.),
- Re-sizing of the networks (change of energy, etc.),
- etc.
The recommended actions can be presented together with the diagnostic report, but as a general rule it will be preferable to keep the two phases (diagnostic and improvement project) separate, as they will require different skills.
5. Checking and monitoring
Having implemented the recommended actions, the effectiveness of the result can only be guaranteed if it is measured and checked. This is a prerequisite for contractual obligations.
On small installations, measurement devices can be simple (index meters) and readings can be taken manually, but as soon as the size or number of consumption points increase, full energy management systems combining measurement and management are more suitable.
These use appropriate computer software which makes it possible to directly establish load profiles, consumption curves and carry out any required processing.
Source: Power balance and the choice of power supply solutions by Legrand
Related electrical guides & articles


Edvard Csanyi
Hi, I'm an electrical engineer, programmer and founder of EEP - Electrical Engineering Portal. I worked twelve years at Schneider Electric in the position of technical support for low- and medium-voltage projects and the design of busbar trunking systems.I'm highly specialized in the design of LV/MV switchgear and low-voltage, high-power busbar trunking (<6300A) in substations, commercial buildings and industry facilities. I'm also a professional in AutoCAD programming.
Profile: Edvard Csanyi

Very Informative. We will strive to implement these regulations at our Health Centers & notify the difference.
Very Informative.
nice article and informative