
Estimated Study Time: 24 minutes
Measurement of power quality
Measuring power quality and finding a bugbear in the network which is messing with the power are considered a highly paid job. Every electrical network and its problems with harmonics, transients, or disturbances are unique and need careful planning, setting the stage, measuring, and finally understanding where the problem is. That’s what power-quality engineers do.
 How to measure power quality? What devices should you use and what to measure?
This technical article is not about the basics of power quality, but the power quality instruments, how to read data, and what to measure. Measurement of power quality requires the use of proper instrumentation to suit the application. The user of the instrument must be well trained in the use and care of the instrumentation.
The engineer should be knowledgeable in the field of power quality.
Power quality work has its rewards. One that every power quality engineer cherishes the most is the satisfaction of knowing that he has left clients happier than when he first met them. That’s what they do, every time.
- Harmonic Analyzers
- Transient-Disturbance Analyzers
- Oscilloscopes
- Data Loggers And Chart Recorders
- True Rms Meters
- Instrument Setup Advice
1. Harmonic Analyzers
Harmonic analyzers or harmonic meters are relatively simple instruments for measuring and recording harmonic distortion data. Typically, harmonic analyzers contain a meter with a waveform display screen, voltage leads, and current probes.
Some of the analyzers are handheld devices and others are intended for tabletop use. Some instruments provide a snapshot of the waveform and harmonic distortion pertaining to the instant during which the measurement is made. Other instruments are capable of recording snapshots as well as a continuous record of harmonic distortion over time.
What is the largest harmonic frequency of interest that should be included in the measurement?
According to Sankaran’s experience (the author of the book “Power Quality”), measurements to the 25th harmonics are sufficient to indicate the makeup of the waveform. Harmonic analyzers from various manufacturers tend to have different, upper-harmonic-frequency measurement capability.
Harmonic distortion levels diminish substantially with the harmonic number. In order to accurately determine the frequency content, the sampling frequency of the measuring instrument must be greater than twice the frequency of the highest harmonic of interest. This rule is called the Nyquist frequency criteria.
According to Nyquist criteria, to accurately determine the frequency content of a 60-Hz fundamental frequency waveform up to the 25th harmonic number, the harmonic measuring instrument must have a minimum sampling rate of 3000 (25 × 60 × 2) samples per second.
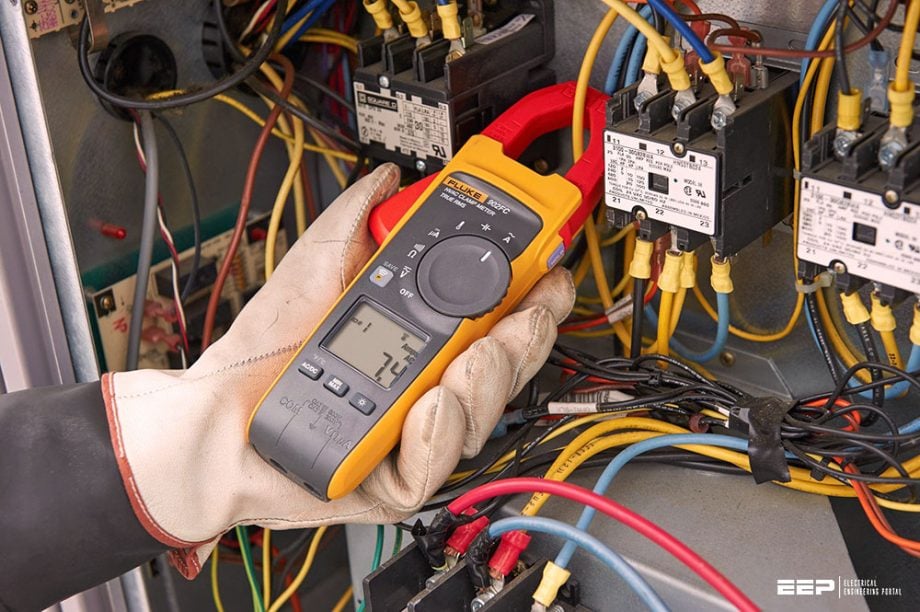
Figure 1 – Current clamp for measuring currents with waveform distortion due to harmonics
Of course, higher sampling rates more accurately reflect the actual waveform. Measurement of voltage harmonic data requires leads that can be attached to the points at which the distortion measurements are needed. Typical voltage leads are 120 to 180 cm long. At these lengths, cable inductance and capacitance are not a concern, as the highest frequency of interest is in the range of 1500 to 3000 Hz (25th to 50th harmonic); therefore, no significant attenuation or distortion should be introduced by the leads in voltage distortion data.
Iron-core current probes are susceptible to an increased error at high frequencies and saturation at currents higher than the rated values. Prior to installing current probes for harmonic distortion tests, it is necessary to ensure that the probe is suitable for use at high frequencies without a significant loss in accuracy.
Manufacturers provide data as to the usable frequency range for the current probes. The probe is useful between the frequencies of 5 Hz and 10 kHz for a maximum current rating of 500 A RMS.
Figure 2 – Handheld harmonic analyzer showing voltage leads and current probe for voltage and current harmonic measurements
It should be understood that, even though the probe might be rated for use at the higher frequencies, there is an accompanying loss of accuracy in the data. The aim is to keep the loss of accuracy as low as possible. At higher frequencies, currents and distortions normally looked at are considerably lower than at the lower frequencies, and some loss of accuracy at higher frequencies might not be all that important.
Typically, a 5.0% loss in accuracy might be expected, if the waveform contains significant levels of higher-order harmonics.
Figure 2 shows the use of a handheld harmonic measuring instrument. This particular instrument is a single-phase measurement device capable of being used in circuits of up to 600 VAC.
Table 1 provides a printout of harmonic distortion data measured at a power distribution panel supplying a small office building.
Table 1 – Voltage and Current Harmonic Spectrum at an Office Building
The table shows the voltage and current harmonic information to the 31st harmonic frequency. Along with harmonic distortion, the relative phase angle between the harmonics and the fundamental voltage is also given. The phase angle information is useful in assessing the direction of the harmonic flow and the location of the source of the harmonics.
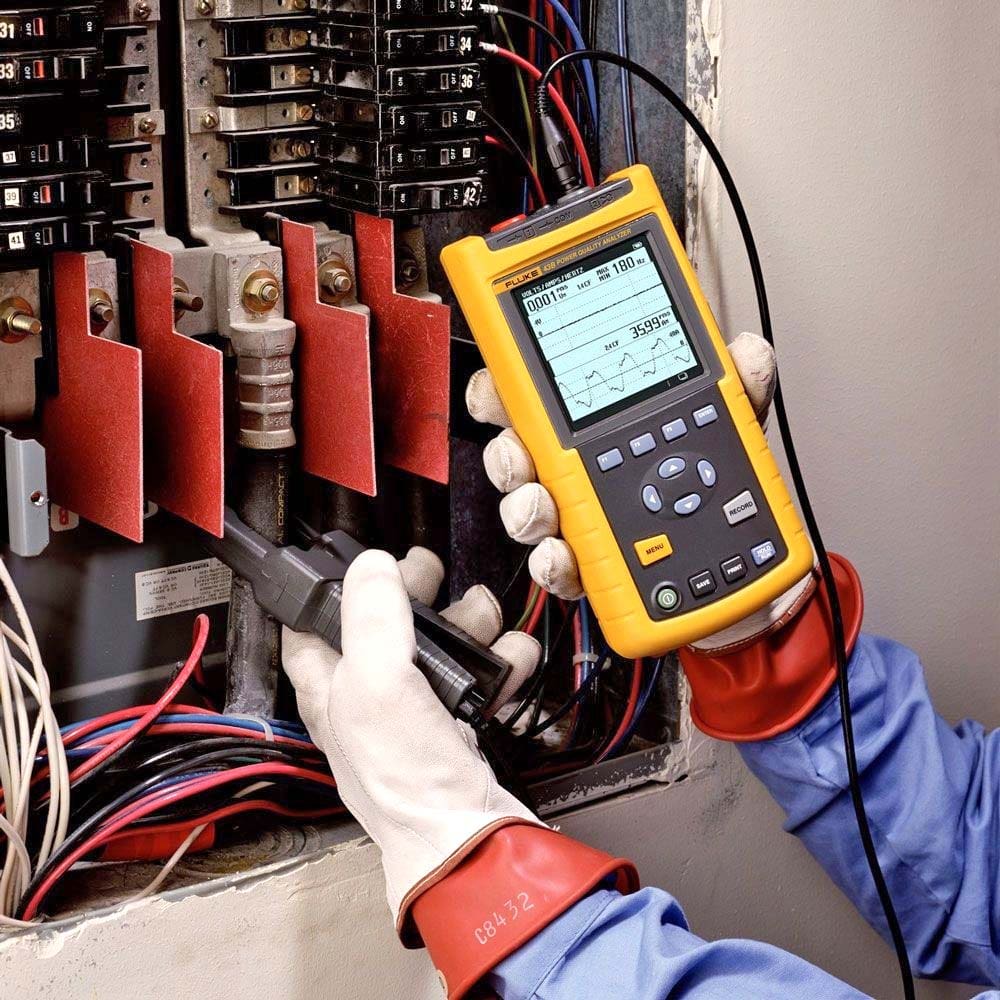
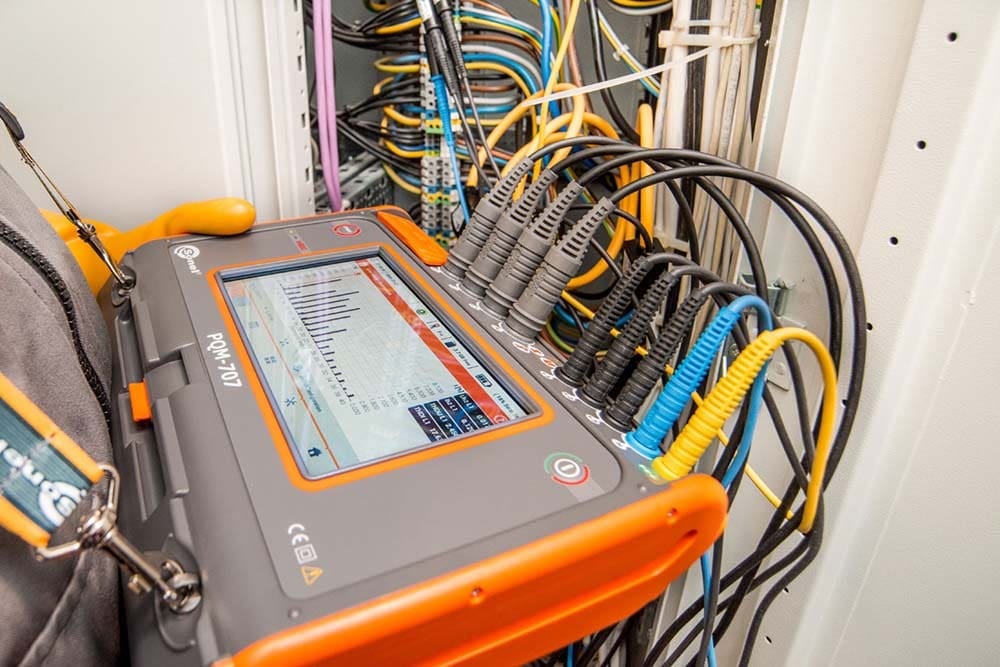
Figure 3 – Three-phase harmonic and disturbance analyzer
A point worth noting is that the harmonics are shown as a percent of the total RMS value. IEEE convention presents the harmonics as a percent of the fundamental component. Using the IEEE convention would result in higher harmonic percent values. It does not really matter what convention is used as long as the same convention is maintained throughout the discussion.
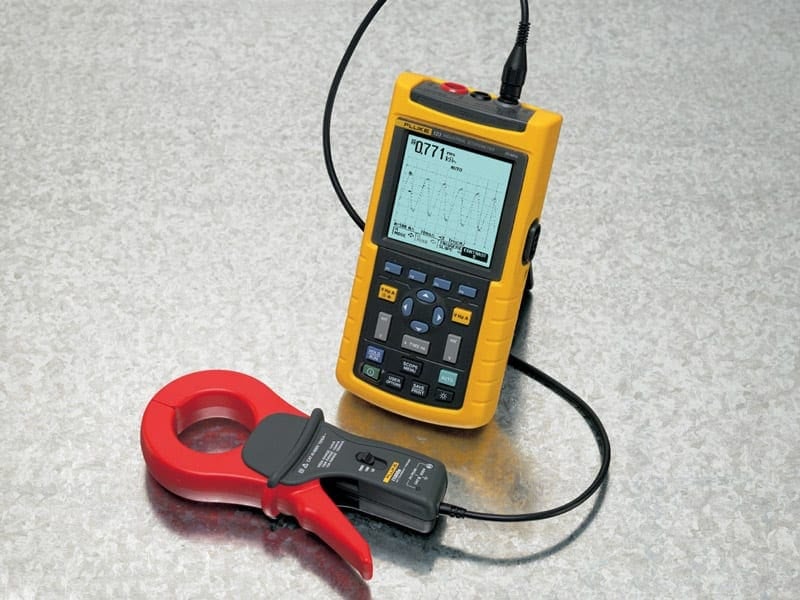
Figure 3 shows a harmonic analyzer for measuring harmonic distortion snapshots and harmonic distortion history data for a specified duration.
Figure 4 provides the current waveform and a record of the current history at the panel over 5 days. The harmonic distortion snapshots along with the history graph are very useful in determining the nature of the harmonics and their occurrence pattern.
Figure 4 – Current waveform and current history graph at a lighting panel supplying fluorescent lighting
2. Transient-Disturbance Analyzers
Transient-disturbance analyzers are advanced data acquisition devices for capturing, storing, and presenting short-duration, subcycle power system disturbances. As one might expect, the sampling rates for these instruments are high.
It is not untypical for transient-disturbance recorders to have sampling rates in the range of 2 to 4 million samples per second. Higher sampling rates provide greater accuracy in describing transient events in terms of their amplitude and frequency content. Both these attributes are essential for performing transient analysis.
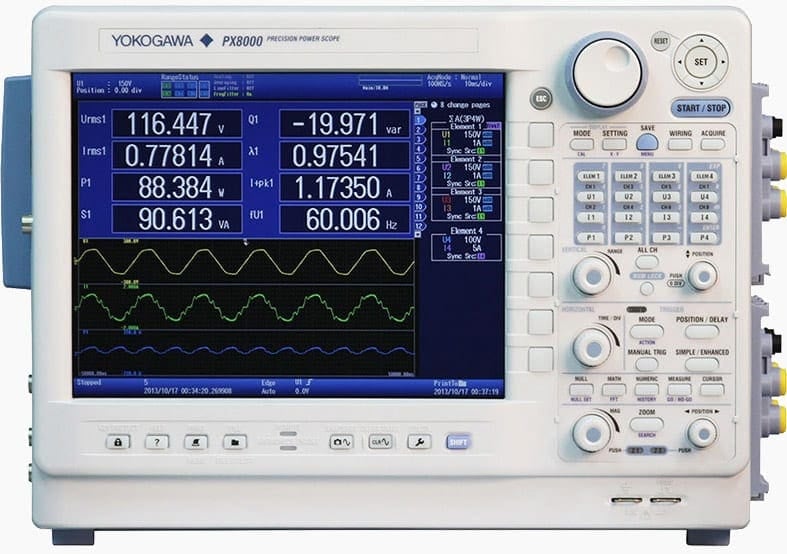
Figure 5 – Power Quality and Transient-Disturbance Analyzer
The amplitude of the waveform provides information about the potential for damage to the affected equipment. The frequency content informs us as to how the events may couple to other circuits and how they might be mitigated.
Figure 6 shows a transient that reached a peak amplitude of 562 V with frequency content of approximately 200 kHz. Once such information is determined, equipment susceptibility should be determined. For instance, a 200-V peak impulse applied to a 480 V motor might not have any effect on motor life; however, the same impulse applied to a process controller could produce immediate failure.
Equipment that contains power supplies or capacitor filter circuits is especially susceptible to fast rise-time transients with high-frequency content.
Figure 6 – Switching transient disturbance with a peak of 562 V and a frequency content of 20 kHz
When measuring fast rise time or higher frequency transients, the length of the wires used to connect the instrumentation to the test points becomes very important. In all of these measurements, the leads should be kept as short as possible.
Typically, lead lengths of 180 cm or less should not introduce significant errors in the measurements of fast transients. At higher frequencies, cable inductance, as well as capacitance, become important factors. The use of longer cable lengths in transient measurements results in higher inductance and capacitance and greater attenuation of the transient waveform.
Current transformers used in transient current measurements must have a peak current rating at least equal to the maximum expected currents; otherwise, current peaks are lost in the data due to the saturation of the current probe.
Figure 7 indicates how current probe saturation resulted in a flat-top current waveform and loss of vital information, making power quality analysis more difficult.
Figure 7 – Current transformer saturation resulting in the loss of vital peak current information
3. Oscilloscopes
Oscilloscopes are useful for measuring repetitive high-frequency waveforms or waveforms containing superimposed high-frequency noise on power and control circuits. Oscilloscopes have e sampling rates far higher than transient-disturbance analyzers.
Oscilloscopes with sampling rates of several hundred million samples per second are common. This allows the instrument to accurately record recurring noise and high-frequency waveforms.
Figure 8 shows the pulse-width-modulated waveform of the voltage input to an adjustable speed AC motor. Such data are not within the capabilities of harmonic analyzers and transient-disturbance recorders. Digital storage oscilloscopes have the ability to capture and store waveform data for later use.
Figure 8 – The pulse-width-modulated waveform from an adjustable speed drive output
Using multiple-channel, digital storage oscilloscopes, more than one electrical parameter may be viewed and stored.
Figure 9 shows the noise in the ground grid of a microchip manufacturing facility that could not be detected using other instrumentation. The noise in the ground circuit was responsible for the production shutdown at this facility. The selection of voltage probes is essential for the proper use of oscilloscopes. Voltage probes for oscilloscopes are broadly classified into passive probes and active probes.
Passive probes use passive components (resistance and capacitance) to provide the necessary filtering and scale factors necessary. Passive probes are typically for use in circuits up to 300 VAC. Higher voltage passive probes can be used in circuits of up to 1000 VAC.
Figure 9 – Electrical noise in the ground grid of a computer center at a microchip manufacturing plant
Most passive probes are designed to measure voltages with respect to ground. Passive probes, where the probe is isolated from the ground, are useful for making measurements when the connection to the ground is to be avoided. Active probes use active components such as field-effect transistors to provide high input impedance to the measurements.
High input impedance is essential for measuring low-level signals to minimize the possibility of signal attenuation due to loading by the probe itself.
Active probes are more expensive than passive probes. The high-frequency current probe is an important accessory for troubleshooting problems using an oscilloscope. By using the current probe, stray noise and ground loop currents in the ground grid can be detected.
Figure 10 – Power analyzer oscilloscope style with modular inputs
4. Data Loggers And Chart Recorders
Data loggers and chart recorders are sometimes used to record voltage, current, demand, and temperature data in electrical power systems. Data loggers and chart recorders are slow-response devices that are useful for measuring steady-state data over a long period of time.
These devices record one sample of the event at a predetermined duration, such as 1 sec, 2 sec, 5 sec, etc. The data are normally stored within the loggers until they are retrieved for analysis. The data from data loggers and chart recorders are sufficient for determining the variation of the voltage or current at a particular location over an extended period and if there is no need to determine instantaneous changes in the values.
In some applications, this information is all that is needed.
But, in power quality assessments involving transient conditions, these devices are not suitable. The advantage of data loggers is that they are relatively inexpensive compared to power quality recording instrumentation. They are also easier to set up and easier to use. The data from the device may be presented in a text format or in a graphical format.
Figure 11 is the recording of current data at the output of a power transformer using a data logger. The data were produced at the rate of one sample every 5 sec. Data loggers and chart recorders are not intended for installation directly on power lines.
Also, data loggers and chart recorders do not provide information about the waveshape of the measured quantity. If that level of information is needed, a power quality analyzer should be used instead.
Figure 11 – Current data from a data logger for one month of tests
5. True Rms Meters
The term true RMS is commonly used in power quality applications. What are true RMS meters? RMS value of the current or voltage can be substantially different from the fundamental component of the voltage or current. Using a meter that measures the average or peak value of a quantity can produce erroneous results if we need the RMS value of the waveform.
For waveforms rich in harmonics, the average and peak values would be considerably different than waveforms that are purely sinusoidal or close to sinusoidal. Measuring the average or peak value of a signal and scaling the values to derive an RMS value would lead to errors.
Figure 12 – True Rms Meter in action

For example, consider a square wave of current as shown in Figure 13.
The average and peak reading meters indicate values of 111 A and 70.7 A RMS current, respectively. The square waveform has an average value of 100 A. The peak value of the waveform also has a value of 100 A. In order to arrive at the RMS value, the 100 A average value is multiplied by 1.11, The ratio between the RMS and the average value of a pure sinusoidal waveform is 1.11.
The peak reading meter would read the 100 A peak value and multiply it by 0.707 to arrive at the RMS value of 70.7 A, with 0.707 being the ratio between the RMS value and the peak value of a pure sinusoid waveform. The disparities in the values are quite apparent.
Figure 13 – Variation in rms measurements when using different types of meters
Figure 13 also shows a triangular waveform and the corresponding current data that would be reported by each of the measuring instruments.
Analog panel meters give erroneous readings when measuring nonsinusoidal currents. Due to higher frequency components, analog meters tend to indicate values that are lower than the actual values. The presence of voltage and current transformers in the metering circuit also introduces additional errors in the measurements.
To accomplish this, the meters require high-frequency signal sampling capability. The sampling rate should satisfy Nyquist criteria in order to produce reasonably accurate results. Some benchtop RMS meters do have the sampling capability and ports to send the information to a computer for waveform display.
6. Instrument Setup Advice
Setting up instruments to collect power quality data is probably the most critical aspect of testing and also one that most often can decide the end results. Setting up is a time when the utmost care must be exercised.
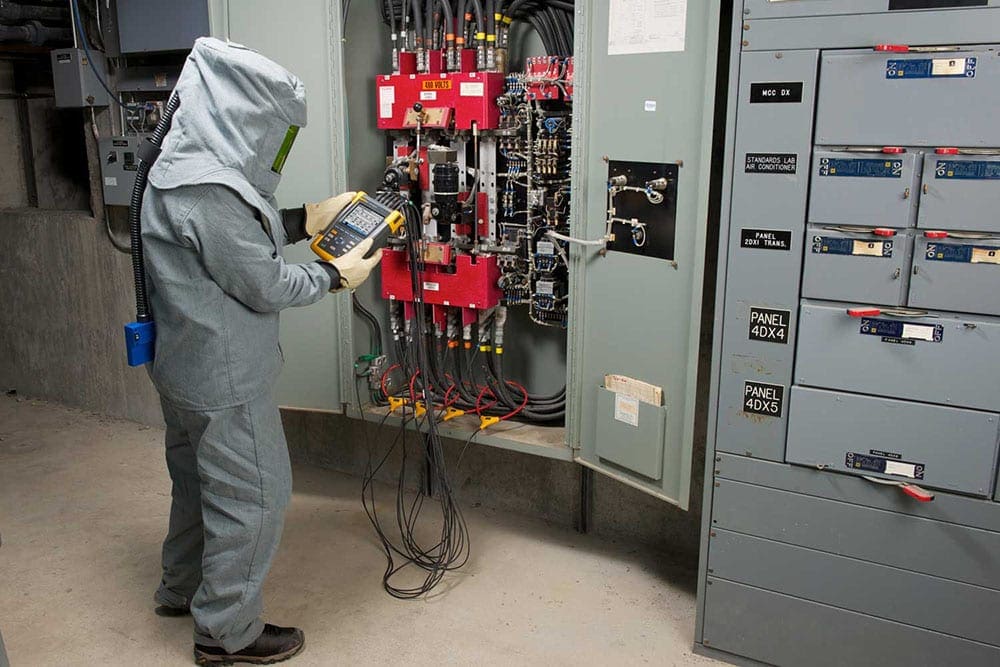
The first step is making sure to observe certain safety rules. In the majority of cases, the power to electrical equipment cannot be turned off to allow for instrument setup. The facility users want as few interruptions as possible, preferably none. Opening the covers of electrical switchboards and distribution panels requires diligence and patience. Personal protective equipment (PPE) is an important component of power quality testing.
While removing panel covers and setting up instrument probes it is important to have someone else present in the room. The second person may not be trained in power quality but should have some background in electricity and the hazards associated with it.
Recommended reading – Electrical safety hazards awareness (with realistic work scenarios)
Electrical safety hazards awareness (with realistic work scenarios)
Sources:
- Power quality by Sankaran C.
Related electrical guides & articles


Edvard Csanyi
Hi, I'm an electrical engineer, programmer and founder of EEP - Electrical Engineering Portal. I worked twelve years at Schneider Electric in the position of technical support for low- and medium-voltage projects and the design of busbar trunking systems.I'm highly specialized in the design of LV/MV switchgear and low-voltage, high-power busbar trunking (<6300A) in substations, commercial buildings and industry facilities. I'm also a professional in AutoCAD programming.
Profile: Edvard Csanyi

very good information
excellent stuff for beginners and pro
Good information
Good information. But i would like to suggest you to put more detailed technical information about power analyzing methods.
Thanks a lot.
Hi, Thanks for your efforts, I wish you pay more attention to experimental and practical items
along with simplified calculation methods.
Best regards : Reza Tousipanah
Good information, I’m surprised you didn’t include Dranetz and our PQ / Energy instruments. Dranetz has been around since the 1960s and still going strong. Looking forward to more articles.
Thanks for your sharing.
Very good information on Electrical Engineering. Keep up