Wind Speed – Mystery Or Not?
When considering wind power, most people ask what the average annual wind speed is and how to get that number. The usual response is that you must monitor the wind speed at your site for at least 12 months, preferably longer, to determine whether a wind generator will work for you.
Sounds too long? Well, yes and no…
For a home system, this isn’t necessary. The costs involved in collecting wind data may not be justified when compared to the total cost of a small wind machine.
There is no economic formula to determine this, but it doesn’t make much sense to spend $1,200 on instrumentation if your wind machine costs only $3,000. You can get close to the actual number by making an educated guess using the empirical methods.
Options For Monitoring The Wind Speed
If you decide to monitor wind speeds, you have several options.
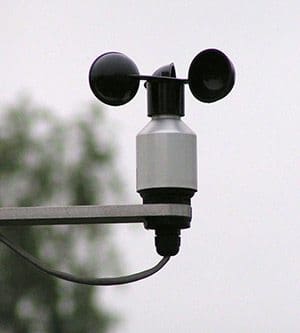
1 The first is to buy a weather anemometer and record observations on a regular basis. This is the least expensive way to collect wind data, but it has disadvantages. For the data to be valid, you must be methodical in collecting it.
Recording one instantaneous wind speed per day won’t do.
2 A second option is to automate data collection by installing a data collection board in a personal computer. This method works, but the computer must stay on all the time, and there are additional costs.
Since these are not plug-and-play components, some computer hardware and software knowledge is necessary.
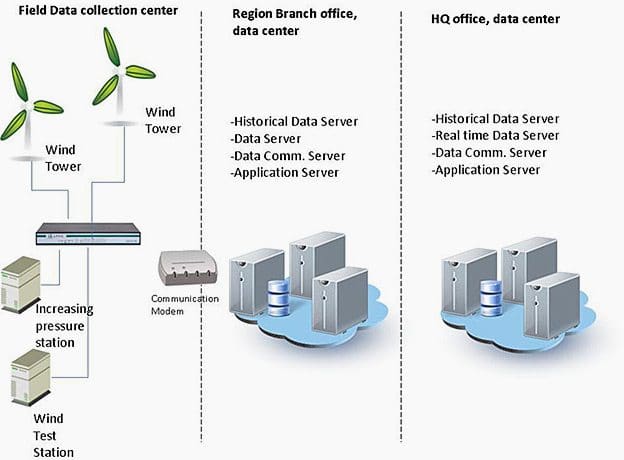
3 A third option is to invest in an anemometer system specifically designed for collecting wind data. The least expensive systems simply average the wind speed over time and cost $200 to $300. These systems usually are sold without towers.
While the average wind speed is a useful measurement, it also is important to know the wind speed distribution.
- A portable tower,
- Instrumentation and
- Data logger.
After collecting data, you have equipment that may or may not be useful to you. The secondary market for used towers and data loggers is limited.
If you buy a used system, consider new instrumentation. This will help ensure quality data.
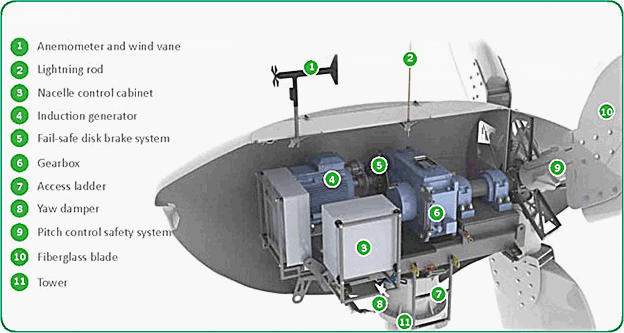
Usually the system has an anemometer and a wind vane. The anemometer measures wind velocity, while the wind vane registers direction. Both instruments should be mounted on a wind pole or tower that is as close as possible to the height at which your wind machine will be mounted.
If your anemometer is mounted too low, it will underestimate the actual wind resource available.
It is generally recommended that the hub height for small machines between 60 feet and 120 feet. Your anemometer also should be within this range.
To generate data for all seasons, average wind speeds along with distribution and peak gust information should be recorded for a minimum of three months, but ideally for a full year. Wind speed data can then be used with performance data for various wind machines to determine the expected output for each machine at your site.
For example, assume you have collected average wind speeds of 12.8 mph, 10.8 mph and 10.4 mph for the last three months, and the published data from a nearby site for the same three months is 10.9, 10.2 and 9.5.
Dividing your data by the published data will give you the following deviation factors: 1.174, 1.059 and 1.095. Averaging these results in a correction factor of 1.109. You can multiply the remaining published data by this correction factor to estimate wind speeds at your site. This method involves a fair amount of interpretation, and some sites do not correlate well.
If you are considering a large project, on-site data is a necessity.
These systems require taller towers – 40 or 50 meters. They include multiple levels of instrumentation and data loggers that can be accessed remotely. Assessing a site’s potential for utilityscale wind development is an expensive undertaking that requires committing significant financial resources.
Wind Turbines – How does it actually work? Investment?
Cant see this video? Click here to watch it on Youtube.
America used 3,200 billion kilowatt-hours of electricity in 1998.
The Energy Information Agency predicts that consumption will increase to 4,400 billion kilowatt-hours in 2020. No single energy source can deliver all the electricity we need to fuel our economy.
Resource: Montana Wind Power – A Consumer’s Guide to Harnessing the Wind







Oh, typo. Mistery should be spelled ‘Mystery.’ ;^)
Thanks Kimgerly! Typo fixed!
Yes, installing a wind turbine does make economic sense for many, but should be based on a number of factors, which includes assessing the wind speed at the prospective site location. I will focus my comments on small wind turbines.
A direct assessment of available wind resources can be made from a one or a combination of direct measurement, local airport + weather service data, wind maps and online resources. And if one decides to perform direct assessment, the anemometer should be located at the future hub height of the wind turbine when monitoring the wind. A good rule of thumb is the anemometer should be at least 30 feet (~9 meters) the closest obstruction within 500 feet (~152 meters). I think it’s also prudent to collect wind directional data.
Using local airport + weather service data does have it’s shortcomings, too, mainly that data collected on shorter towers does not exist–so it has to be extrapolated. Often these towers are not sited in good locations e.g. near a building roof, trees, etc. and the ground drag and turbulence diminishes the wind speed. This data is these towers are located in the least windy locations to ensure safe take off and landing for airplanes. The biggest problem is extrapolating the data to hub height from one data point is considered iffy.
Wind maps, although they are typically reported around 165 feet (50 meters) to 195 feet (60 meters) above ground surface, most smaller wind turbines are mounted at about 80 feet (25 meters), to 120 feet (48 meters), and sometimes as low as 60 feet. I can personally attest to the latter. Resolution, however, can be a limiting factor and location is everything–just because a map shows a good wind resource in any area, does not necessarily mean this is the case. Natural vegetation and buildings can greatly reduce the wind flow regime at downwind sites, but for some hills or cliffs can be magnified. Rule of thumb: The more complex the terrain, the less accurate the wind maps are.
As far as online resources goes, the Surface Meteorology and Solar Energy website is a good starting point. Monthly averaged data for the entire globe is available. Even if data from this resource presents a good resource, topography, vegetative cover and the proximity of trees, hills, cliffs and buildings still requires consideration.
Some other phenomenon can be used to verify the other data for a good wind resource e.g. flagging, snow fences, clouds of dust/snow, windbreaks, tattered flags on flag poles, tilting electric/telephone poles.
Hi
Very good article!
Well, from my knowlegde about ” Site Assement”, what I can say, is you are working on a wind farm project, measure wind is a priority, On large scale, 1 year is the minimum, most of the companies like: Repower, Enercon, Areva, Gamesa, Vestas have teams of professionals who are responsible for measure the potencial of that site. When you collect the data from data logger ( using a memory stick ) or via GSM, you must “clean” your excel sheet with possible errors, and then you can make conclusions. The available power in cinetic energy from the wind is equal to: P = 1/2 * Density of air * Area covered by the blades * wind velocity^3 (cubic root).
This cubic root is very very important, fro the start we don´t want extreme wind velocity, but good wind velocity like 12m/s.