
Estimated Study Time: 21 minutes
Operational substation simulation
Designing and operating a substation is a tiresome and challenging task, which requires hefty capital, a well-trained workforce, and lots of time. With the ever-expanding nature of electricity distribution, the MV/LV power distribution substations are mushrooming everywhere. Sometimes, they are even installed in bulk numbers with preset design and loading conditions.
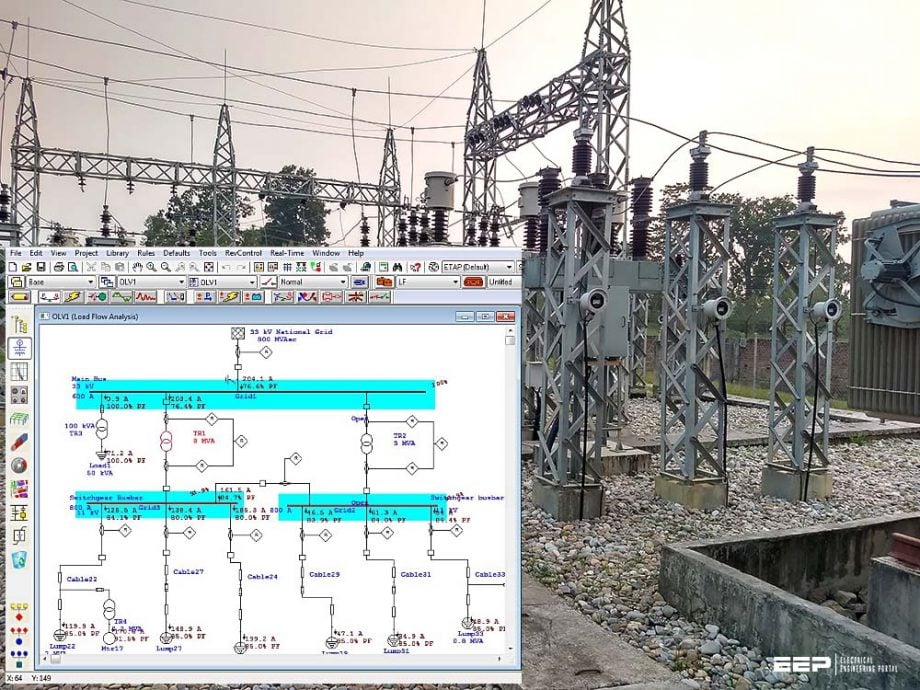 Figure 1 - Load flow and short circuit analysis of a MV substation (case study 33/11 kV substation in ETAP)
While doing so, the equipment selection is done based on the general design criteria rather than customized sizes and specifications. For instance, in most of the MV substations, the VCBs, isolators, and other active components are oversized and maintain uniformity as far as possible.
This comes often in practice to cut the cost of customized manufacturing of components. It is a common practice for OEMs to manufacture the equipment in standard sizes and ratings to allow mass production. In between all these, the designers and technicians are left to choose from the available standard sizes and specifications.
It is even a possibility that the technicians may not be aware of exact technical requirements. There are many reliable software and platforms to design and check the technical requirement in the power system. The engineers and designers must be familiar with the actual technique and methods.
This article familiarizes its reader with the perks of technical analysis of a substation, either in the design phase or in operation, based on a real-world case study performed in ETAP.
- Load flow analysis
- Short circuit analysis
- A case study: 33/11 kV substation for power distribution
- Making use of simulation results
- BONUS – Etap project of case study
- Video tutorials
1. Load flow analysis
Load flow analysis is a steady-state analysis of any power system network to determine the operating condition and parameter (Voltage, phase angle, and branch current) for a set of loading conditions. It uses a technique to solve a set of non-linear algebraic equations to approximate the unknown variables of power systems.
Most of the modern-day power utility software: ETAP, Power world simulator, PSS-E, etc. are based on the fast and accurate Newton-Raphson or fast decoupled numerical algorithm to solve the power flow equations. It helps to determine the power or current flow for each branch or bus in the network, once the most accurate value of voltage is obtained.
In the MV or any other radial substation, the load flow calculation is essential to cross-check the system for its adequacy to withstand the maximum connected load. This will give the idea of maximum voltage drop, maximum current, and power factor in the live components like busbar, circuit breakers, etc. for a particular loading condition.
Suggested course – Power System Analysis, Modelling, Load Flow and Fault Studies for True Engineers

Go back to the Contents Table ↑
2. Short circuit analysis
Short circuit analysis is a procedure that calculates the fault current at each point in a network upon an occurrence of a fault in a certain section of the network, which is essential to approximate the breaking capacity and fine-tuning of current interrupting devices and protective devices.
The output of short circuit analysis helps predict the incident energy levels and planning protection coordination. It involves the conversion of the network into a combination of equivalent impedance and a voltage source to approximate the fault current at the moment of fault. For MV substation, the internal resistance of cables, transformer impedance, etc. contributes to the calculation of equivalent impedance.
However, it is equally essential to periodically maintain the short circuit analysis data over time to refine the settings of protection elements and replace them if required.
Suggested read – How to reduce short-circuit currents in MV applications
How to reduce short-circuit currents in medium voltage applications
Go back to the Contents Table ↑
3. A case study: 33/11 kV substation for power distribution
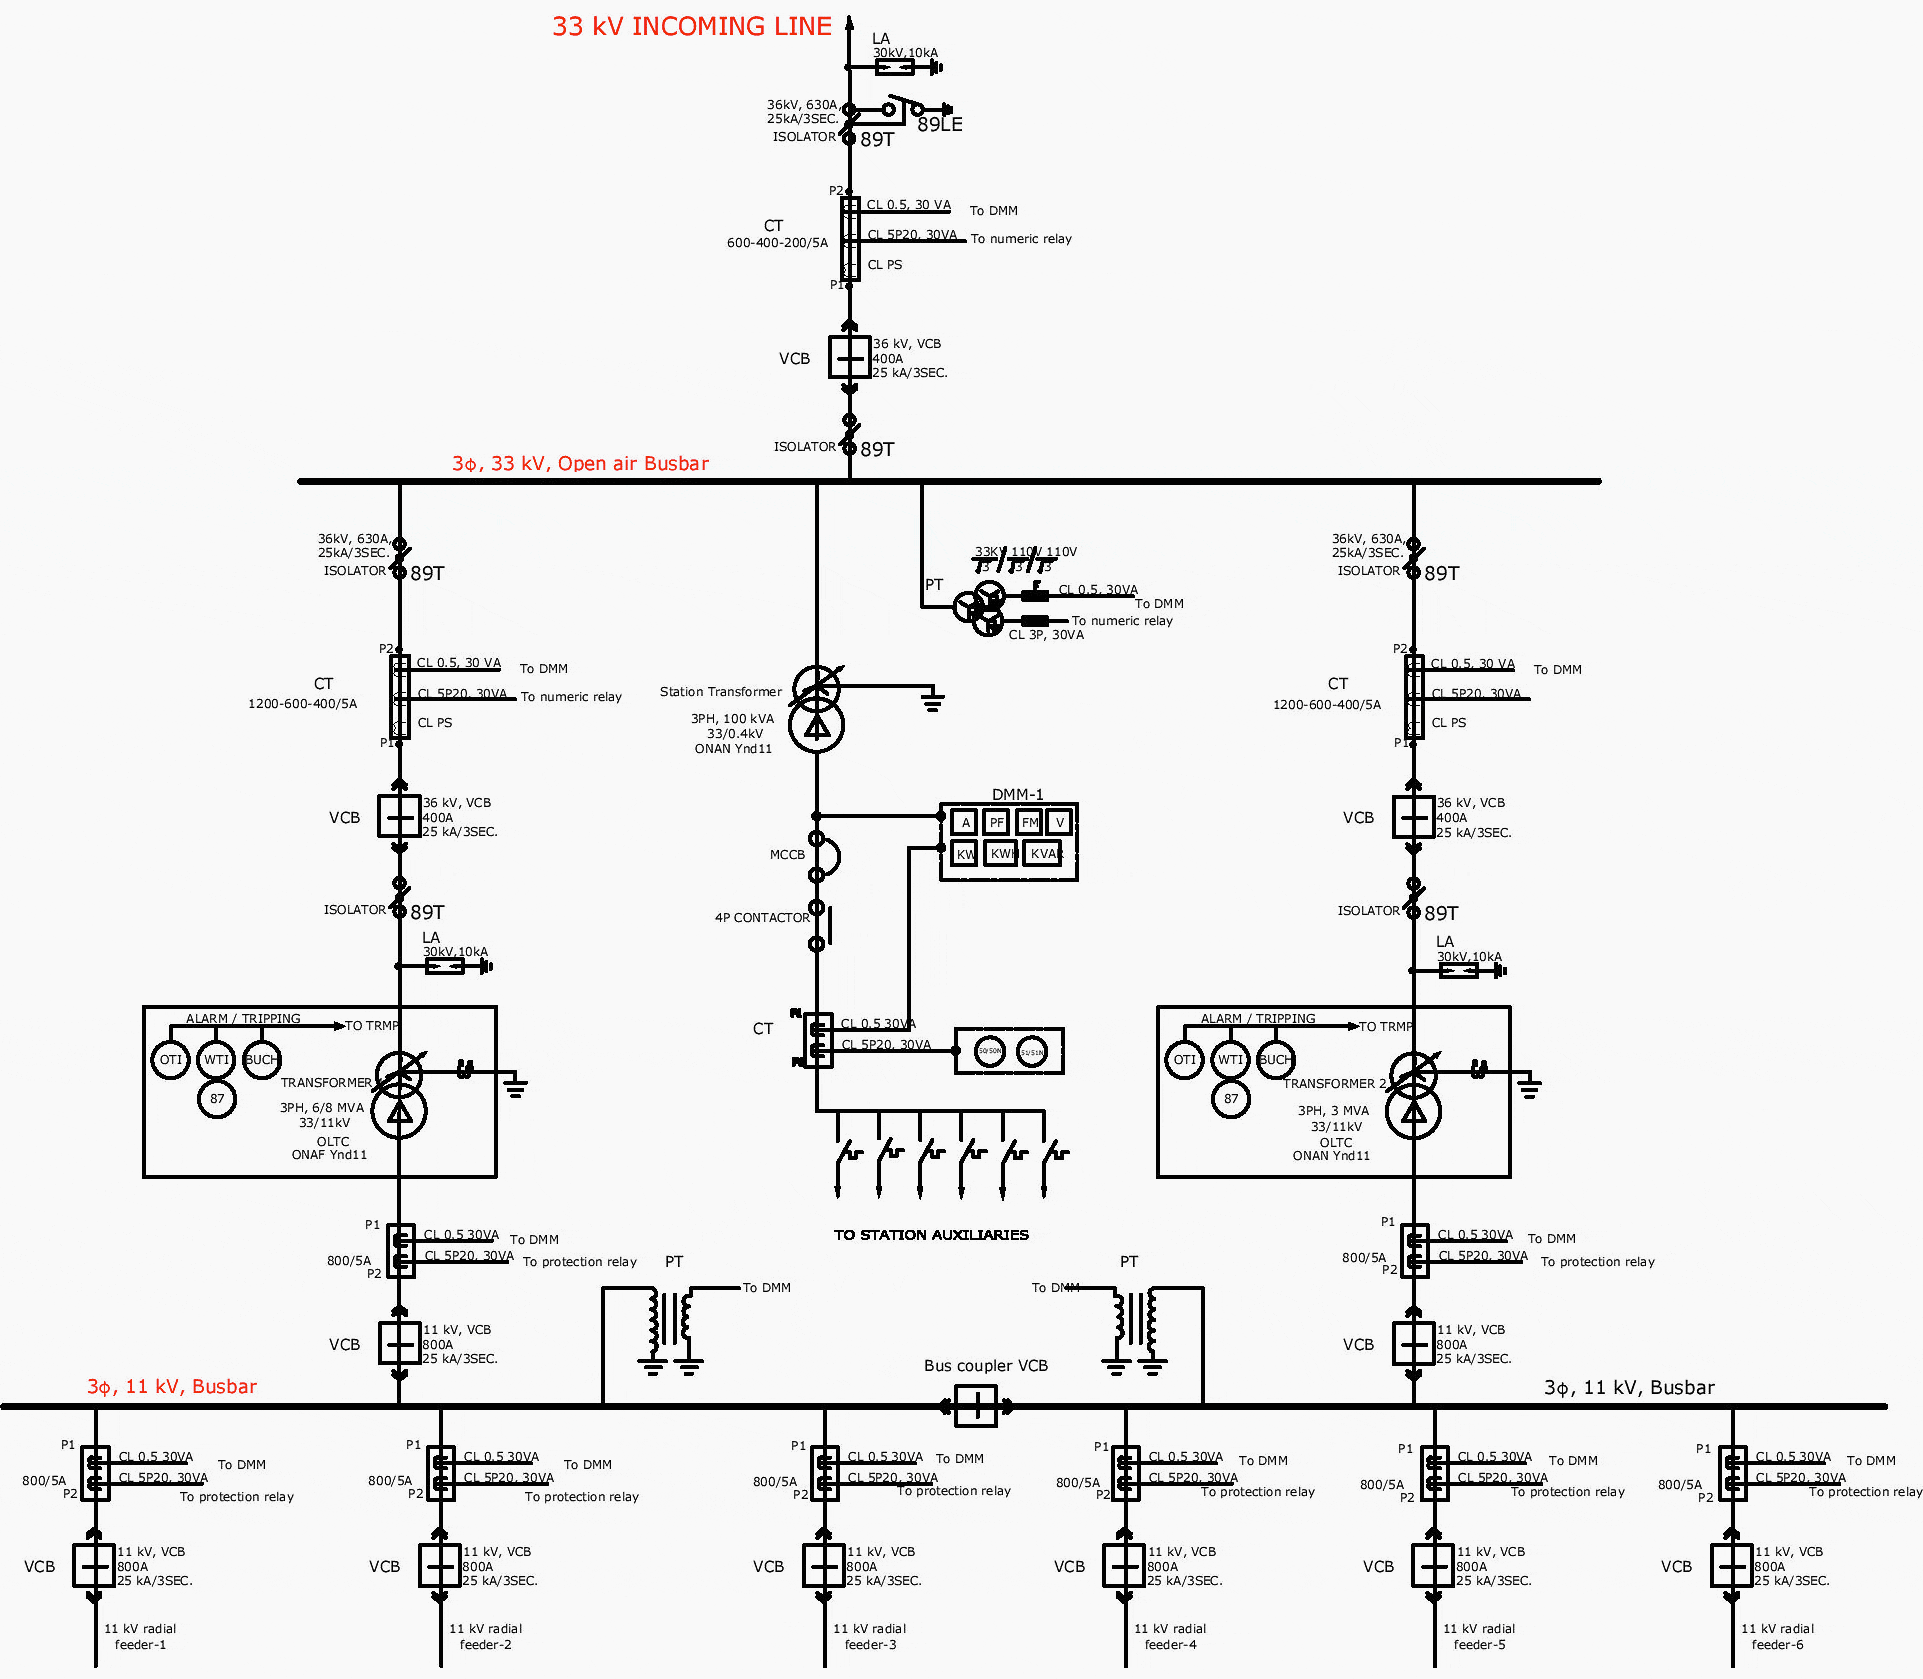
This article uses a 33/11 kV, 11 MVA power distribution substation for a case study. The substation is functional since 2001, and most of the design documents are misplaced already. Some equipment is replaced during multiple periodic and breakdown maintenance.
The single line diagram in Figure 2 provides most of the details required for the ETAP modeling of the substation for load flow and short circuit analysis. The analysis will serve as a reference to cross-check the operating condition for recent loading conditions obtained from the load curve data in the substation logbook.
Figure 2 – Single line diagram of a 33/11, 11 MVA Power distribution substation
Go back to the Contents Table ↑
3.1 Preparatory data for simulation
Figure 3 illustrates an ETAP model of the case substation of this article. A major factor for the accuracy of simulation output is the right selection of parameters and equipment, and the major focus should be to replicate the real-world case as far as possible.
In this case, the Short circuit MVA for the incoming grid is defined based on the capacity and percentage impedance of a power transformer in the source. The impedance of the transmission line from the source to the substation may or may not be included in the simulation.
Normally, to emulate the most pessimistic scenario, the designers and engineers can sometimes opt to neglect the impedance of the live parts like cable, line conductors, etc.
Figure 3 – ETAP simulation conversion of available SLD of the substation (click to zoom)
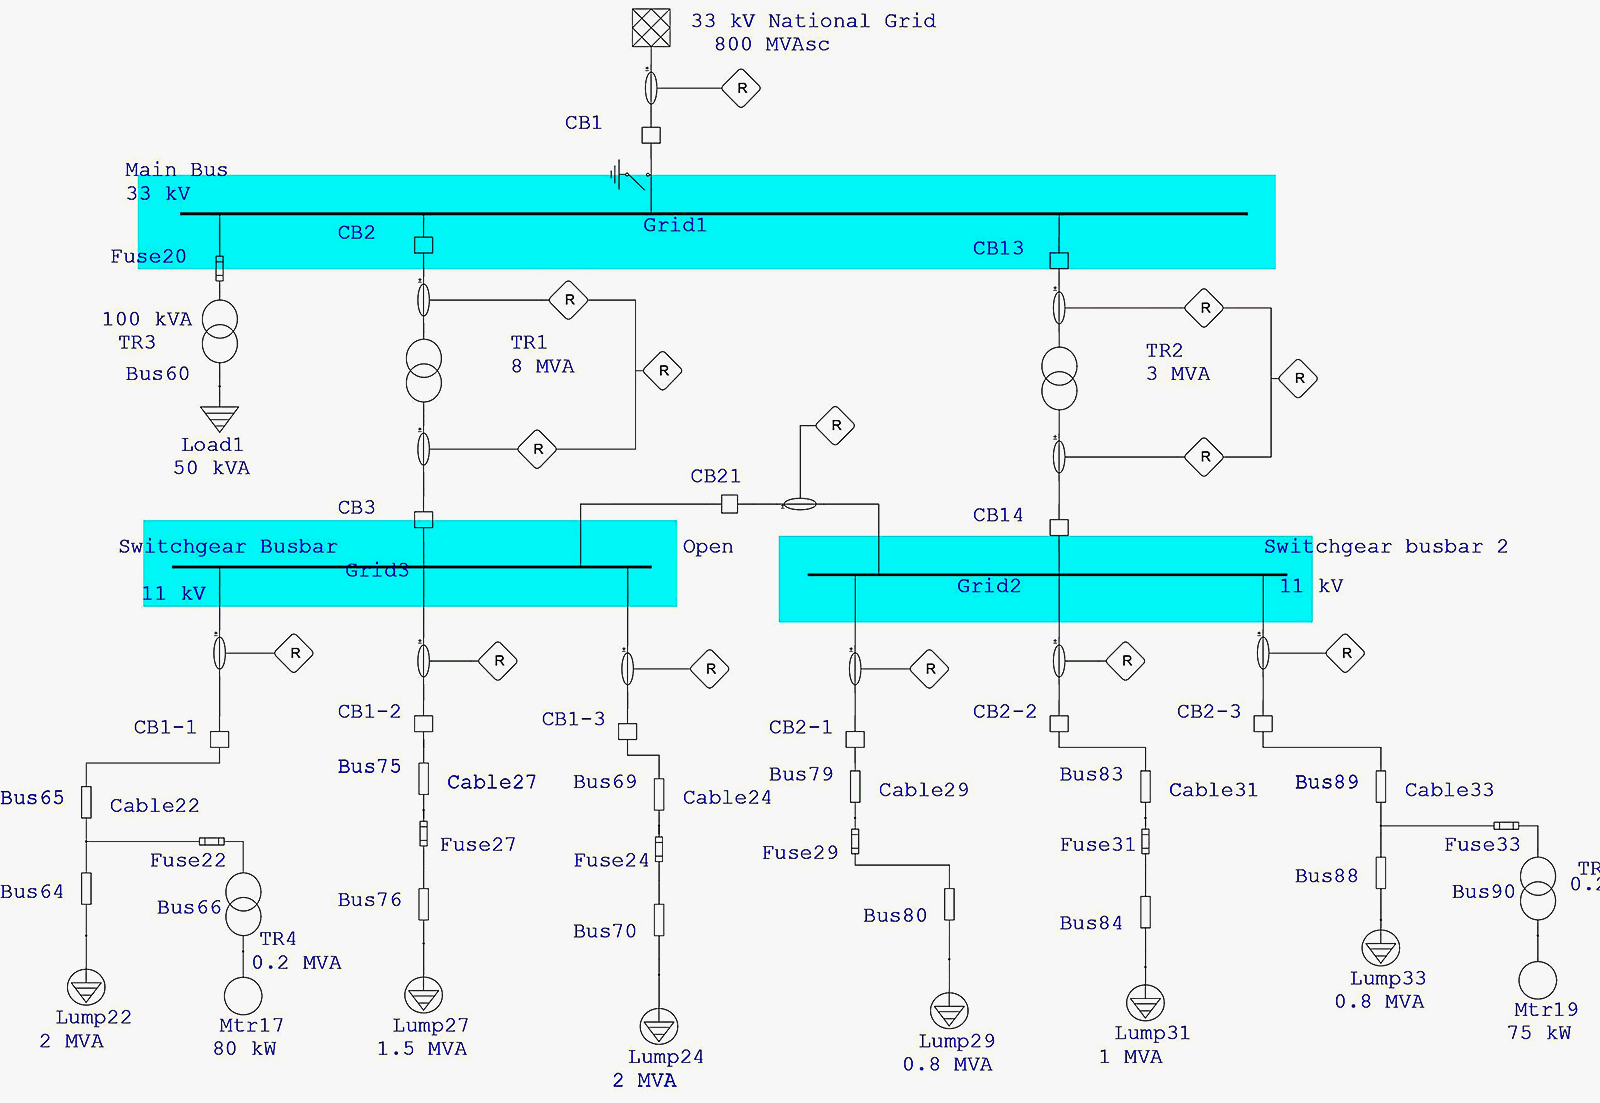
The sizing and ampacity of the busbar, breakers, switches, etc. are kept identical to the actual case. Likewise, the percentage impedance of power transformer and station transformer in the substation are of prime importance too, which can be obtained from datasheets of respective components.
Related electrical guides & articles


Bishal Lamichhane
Electrical Engineer (B.E Electrical, M. Sc Engineering) with specialization in energy systems planning. Actively involved in design and supervision of LV/MV substations, power supply augmentations and electrification for utilities and bulk consumers like airports and commercial entities. An enthusiast and scholar of power systems analysis.Profile: Bishal Lamichhane
