
Estimated Study Time: 24 minutes
Transmission losses
Like all other power system systems, no matter how carefully the system is designed, losses are present and must be modeled before an accurate representation of the system response can be calculated. Due to the size of the area that the power system serves, the majority of the system components are dedicated to power transmission.
 Losses in the transmission system, line models and ways to reduce them (photo credit: S. Inoué via Flickr)
The focus of this paper is to describe the losses that occur in the transmission system, present component models, and investigate ways to reduce these losses.
Let’s see the topics we will cover in this technical article:
- System Parameters
- Skin Effect
- Transmission Line Models (by lenth)
- Corona Loss
- Transformer Losses
- Summary
1. System Parameters
When current flows in a transmission line, the characteristics exhibited are explained in terms of magnetic and electric field interaction. The phenomena that results from field interactions is represented by circuit elements or parameters. A transmission line consists of four parameters which directly affect its ability to transfer power efficiently.
These elements are combined to form an equivalent circuit representation of the transmission line which can be used to determine some of the transmission losses.
The conductance of the line is affected by many unpredictable factors, such as atmospheric pressure, and is not uniformly distributed along the line.
The influence of these factors does not allow for accurate measurements of conductance values. Fortunately, the leakage in the overhead lines is negligible, even in detailed transient analysis. This fact allows this parameter to be completely neglected.
The primary source of losses incurred in a transmission system is in the resistance of the conductors. For a certain section of a line, the power dissipated in the form of useless heat as the current attempts to overcome the ohmic resistance of the line, and is directly proportional to the square of the rms current traveling through the line.
It directly follows that the losses due to the line resistance can be substantially lowered by raising the transmission voltage level, but there is a limit at which the cost of the transformers sand insulators will exceed the savings.
The efficiency of a transmission line is defined as:

where PR is the load power and PLoss is the net sum of the power lost in the transmission system.
As the transmission dissipates power in the form of heat energy, the resistance value of the line changes. The line resistance will vary, subject to maximum and minimum constraints. in a linear fashion.
If we let R1 be the resistance at some temperature, T1, and R2 be the resistance at time T2, then:

if T1 and T2 are given in degrees Centigrade.
This flow of charge is known as charging current and is present even when the transmission line is terminated by an open circuit.
The alternating currents present in a transmission system are accompanied by alternating magnetic fields. The interaction of these magnetic fields between conductors in relative proximity creates a flux linkage. These changing magnetic fields induce voltages in parallel conductors which are equal to the time rate of change of the flux linkages of the line. This voltage is also proportional to the time rate of change of the current flowing in the line.
The constant of proportionality is termed as the inductance.
Due to the relative positioning of the lines, the mutual coupling will cause voltages to be induced. The induced voltage will add vectorally with the line voltages and cause the phases to become unbalanced.
When a 3-phase set is unbalanced the lines do not equally share the current.
Looking at only the simple resistive losses in the circuit, and recalling that the power loss is directly proportional to the square of the magnitude of the current flowing in the line, it is easy to see that the losses in one line will increase significantly more than the reduction of losses in the other lines.
The affect of this mutual coupling is often reduced by performing a transposition of the transmission lines at set intervals. The transposition governs the relative positioning of the transmission lines. Each phase is allowed to occupy a position, relative to the other two phases, for only one third of a distance. Then the phases are rotated so their positions, relative to one another, change.
By proper rotation of the lines, a net affect of significantly reducing the mutual inductance is realized. The actual phase transposition usually does not take place between the transmission towers.
A certain safe distance must be maintained between the phases and, because of the difficulty in maintaining the required distances between the phases, transposition is most likely to take place at a substation.
2. Skin Effect
The internal flux of a conductor produces a phenomena known as skin effect. This flux consists of flux lines which are circular and concentric with the conductor surface. This results in flux lines which only link a portion of the conductor’s cross section.
Therefore the central cross sections of the conductor have larger total flux linkages than the portions closer to the outside of the conductor. This means that a higher voltage will be induced, longitudinally, in the inside of, the conductor than on the outside.
The total voltage gradient, however, must be the same in the conductor whether it is measured along the axis on the inside or along the outer surface.
Consequently, the current will not be uniformly distributed over the cross sectional area of the conductor. Instead the current density will be greater closer to the surface of the conductor. The ohmic voltage drop is directly proportional to the current density and is larger at the surface.
This compensates for the opposite variation of induced voltage and maintains the uniformity of the total voltage change per unit length.
Skin depth is the measurement of the lateral penetration of the current within a conductor.
As mentioned previously, the depth of penetration is determined by the internal flux arising from the current carried within a conductor. External flux linkages have no effect on the skin depth of a line. The skin depth of a copper conductor transmitting a 60 Hz. signal is approximately 0.75cm.
As a result, not much of the current flows in the center of the conductor.
This fact is a fortunate one because it allows the aluminum conductor, whose skin depth is root two times that of copper, transmission lines to be reinforced with a braided steel core without lowering the current carrying capacity.
3. Line Models
Due to the required distances between conductors, the loops formed between outgoing and return conductors are of considerable area. The changing flux in these loops will generate opposing voltages in the conductors which may be of considerable importance – particularly in regard to the voltage regulation of the line.
With the exception of detailed transient analysis and some calculations for long transmission lines, the models for short lines, medium length lines and long lines are based on a lumped parameter representation of the system.
3.1 Short Lines
A transmission line with length less than 50 miles (80.5 km) is classified as being a short transmission line.
When power is transmitted along a short transmission line the difference in conditions at the sending and receiving ends is due to the series impedance of the line. The impedance is that of a series connection between a resistive and an inductive element shown in Figure 1, where VS and VR are the sending and receiving line to neutral voltages and IS an IR are the sending and receiving currents.

Since there are no shunt components:
![]()
![]()
The induced voltage in the line is directly proportional to the current and will depend on the physical dimensions of the conductor. The value of this induced voltage, per mile, for a single conductor is given by:
where:
- d is the distance between conductors
- r is the radius of the conductor
- I is the rrns amplitude of the current
- f is the frequency of the current in hertz
The effect of the line impedance and the variation of the load power factor can best be seen in the load regulation of the line.

where |VR,NL| is the magnitude of the receiving end voltage at no load and |VR,FL| is the magnitude of the receiving end voltage at full load.
3.2 Medium Lines
Lines of length between 50 and 150 miles (80.5 km and 241.4 km) are classified as medium length transmission lines.
A shunt capacitance is added to the short line model to create the model for medium length lines. This extra element is needed due the increase in line length increases the capacitance, and its affects on the system become significant.
The line capacitance between two parallel cylindrical conductors given in micro Farads (μF), per mile, is:
where a is the distance between the conductors divided by the diameter of the conductor.
By modeling the line in this manner, the receiving end voltages and currents can be obtained using the lines ABCD parameters from a two port network shown in Figure 3 below.


3.3 Long Lines
As transmission lines grow in length, the affect of the capacitance becomes more predominant. There is a sizable component of the total current which leads the voltage by 90 degrees, and the voltages induced by this current lags the phase current by 90 degrees and produces the charging current.
This reduces the necessary size of the sending voltage.
The affect is most noticeable when the lines are subjected to very light loads. The long line model is similar to that of the medium line. The difference is that the long line is represented by distributed parameters instead of lumped parameters.
4. Corona Loss
The air present in ow atmosphere is most commonly considered to be a good insulator, however, it is far from perfect. The imperfections result from the fact that there are always a small number of ions present due to various forms of radiation.
When air is subject to an uniform electric field, the ions and electrons in the air are set in motion. By means of convection they maintain a small flow of current which, in most cases, can be neglected.
This process continues and an ion avalanche occurs.
The field around a conductor is not uniform but has a peak value at the surface of the conductor. Hence the value of the field drops of at a rate which is inversely proportional to the distance from the conductor.
The steep voltage gradient present at the conductor surface facilitates such ionization and serves as the catalyst to ion avalanche. The ionization persists around the conductor and is accompanied by a glow from which it gets its name. The ions produced result in space charges which are being moved by the alternating field.
The energy that is expended in the moving of these ions is removed form the transmission line itself, so it is considered to be a transmission loss.
The rate at whch ionization occurs is not uniform, but rather occur as fluctuations which produce sudden changes in the electric field and result in radio interference.
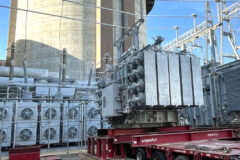
5. Transformer Losses
In practice, the most effective way to reduce losses incurred in the transmission network has been through the use of transformers. Transmission lines serving as links to an area with a modest load demand would experience extremely high losses if they were required to carry the full load current.
To prevent this from occurring , the line voltage is stepped up by a large ratio N, while the line current is simultaneously stepped down by a factor of 1/N. This allows the transmission lines to carry the large amount of power while greatly reducing the system losses.
The winding, or copper, loss is determined in a straight forward manner from the resistance of the winding and is expressed as:

The core loss encountered is a transformer is expressed in terms of hysteresis and eddy currents. These two have a net loss that may be approximated as varying linearly with the frequency f, and having a nonlinear dependence on the flux intensity B of the core material.
![]()
Hysteresis loss results from the unrecoverable energy expended to rotate the polarization of the core’s magnetic material. The energy loss per unit cycle is expressed as the area enclosed by the hysteresis loop.
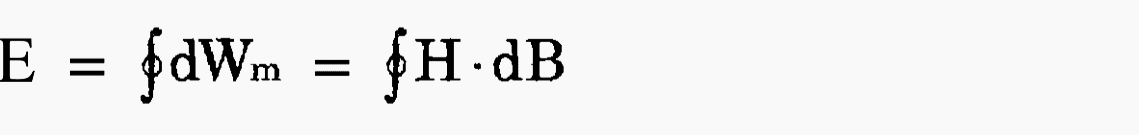
The total hysteresis loss is the product of this area, the core volume, and the frequency. Eddy current loss is simply expressed as the I2R loss due to the currents induced in the magnetic material.
In order for the windings to be coupled magnetically, the B field must be created by one winding and linked by the other. The main component of the core which accomplishes the link is the magnetizing inductance which is modeled by a large inductor.
Unfortunately, not all of the flux produced in one winding is successfully linked to the others. Some of the flux leaks from the core and has a return path through the air. This effect of the imperfect coupling is modeled as a small series inductor known as the leakage inductance.
Many design methodologies have been formulated in an attempt to reduce the leakage inductance. By placing the windings directly over the top of one another, all of the flux in the core is linked by both windings. However, there still exists a small amount of flux generated in the outer winding that is not linked by the inner windings.
Another approach is to recognize that the leakage flux increases with the winding thickness. Windings that are long and slim yield lower values for leakage inductance than do windings that are short and fat.
Since the leakage flux has a return path that is external to the core, it results in electromagnetic interference (EMI). To minimize EMI, a one-foil wide winding is short circuited and placed around the entire magnetic circuit. The leakage flux induces currents in this shorted winding which create an opposing flux and reduce the EMI.
Although the exciting current is non-sinusoidal, it can be represented as a magnetizing component Im, and a core loss component Ic. The exciting current is modeled as a shunt conductance Gm in parallel with the magnetizing inductive reactance Xm.
The model for a typical transformer is shown below:

6. Summary
By understanding the interactions of magnetic and electric fields, equivalent circuit models can be constructed to describe the phenomena which takes place within a transmission line.
An analysis of these – Models will quantify some of the losses within a transmission line, which consist of 3 to 5 percent of the load. Depending on the level of accuracy desired and the length of the line, models of varying complexity may be used to describe the system.
The use of transformers in the transmission system greatly reduces the I2R losses, but the transformer does bring some additional elements into the loss equations.
Reference // Losses In Electrical Power Systems By T. D. Collins
Related electrical guides & articles


Edvard Csanyi
Hi, I'm an electrical engineer, programmer and founder of EEP - Electrical Engineering Portal. I worked twelve years at Schneider Electric in the position of technical support for low- and medium-voltage projects and the design of busbar trunking systems.I'm highly specialized in the design of LV/MV switchgear and low-voltage, high-power busbar trunking (<6300A) in substations, commercial buildings and industry facilities. I'm also a professional in AutoCAD programming.
Profile: Edvard Csanyi

This might be interesting to you and your readers:
“Transmission Lines at Audio Frequencies, and a Bit of History” By Jim Brown (see references at end of paper)
http://audiosystemsgroup.com/TransLines-LowFreq.pdf
very interesting lecture and i will like to have a comprehensive lectures materials on this topic
This articles have well described in details. But they won’t be saved in PDF. Please let me know how to.
In site testing & commissioning of power system apparatus, HVDC testing is employed for HV/EHV Power cables. However, DC testing is not adopted in buses, Switchgears, circuit breakers,isolators , Transformers
CT,VT etc. The reasons given by the Design Engineers of particular apparatus is, it is not specified in standards. But, 5KV,10KV Meggers are used in IR tests. What is the problem in using HVDC testing at site instead of AC testing?
Good article, well summarized. Referenced videos are not as good as the content, but it helps.
Dear all
this is the very good lecturer with the video I am interesting that s lecturer.
please, any of electrical engineering lecturer or video send me.
Thankful