
Estimated Study Time: 33 minutes
GIS Monitoring Techniques
This article provides guidance on how to conduct gas monitoring and explains the various alerts that can be set. The many sorts of defects that might lead to partial discharges are discussed, and various partial discharge measuring techniques are described, including electric and acoustic, chemically-specific methodologies for monitoring partial discharges utilizing GIS.
 SF6 Gas Monitoring and Alarming Practices in Gas-Insulated Switchgear (GIS) Systems
The monitoring of gas density and other circuit breakers is included in the “other monitoring” section.
There are numerous applications for GIS monitoring. Many of them are also present on other switchgear and breaker components and are not specific to GIS. Gas detection is the standard monitoring method. Almost every piece of equipment that uses SF6 gas, such as GIS and breakers, should have a gas monitor installed on them.
The use of circuit breakers in monitoring systems is widespread. Several commercial products, from both original equipment manufacturers (OEMs) and third-party vendors, are available for breaker monitoring, thus GIS is not the only option.
Over the past ten to fifteen years, there has been a growing interest in partial discharge (PD) monitoring due to its potential to forewarn of emerging insulation concerns in the GIS. Since data analysis typically calls for human interpretation, few commercial solutions exist.
1. SF6 Gas Monitoring
The SF6 gas in GIS is used for electrical insulation and arc quenching in the circuit breakers. Both characteristics are affected by the SF6 gas’s density. Gas pressure, rather than density, is frequently used in discussions of gases. Fill pressure and normal operating pressure are two examples of phrases that appear frequently in written materials. Gas density is the critical factor, yet pressure is utilized since it is simple to measure and understand.
Unlike density, pressure is highly temperature dependent. (provided a state change is not involved). The main reason for gas monitoring is to make sure there is enough SF6 gas to run the machinery. In most cases, this requires checking the gas density.
During operation, the gas temperature in a GIS system may be higher near the central conductor than in the enclosure, where the gas density meter is typically installed. As a result, a density measurement taken within the enclosure may artificially inflate estimates of population within the livable regions of the GIS.
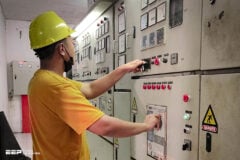
Figure 1 – Gas density monitoring indicator mounted on the GIS enclosure
The above Gas density monitor displays temperature-compensated pressure with a simple to read dial and with color codes. Built-in relays are used for signaling when certain thresholds are encountered.
Equipment temperature and density can also be affected by factors like convective movement within the enclosure, solar gain (for outdoor installations), and so on.
These changes in density are typically treated as incidental, and safety margins are built into the establishment of SF6 density criteria to account for them.
Depending on the configuration, gas density monitoring systems can offer one of two useful outputs:
Output Type #1 – Continuous Output Signal
For diagnostic reasons, these can be used to track trends. For instance, historical data could tell you if the leak you’re seeing is the result of gradual wear and tear or a sudden increase in severity. Information trends can also be used to monitor SF6 emissions, which can aid in conforming to environmental standards.
Since SF6 gas is a potent greenhouse gas, keeping an eye on emissions is crucial!
Output Type #1 – Threshold Alarms
When the concentration of the gas falls below a predetermined level, an alert is sent out. In most cases, two cutoffs are employed. The first one is a low gas light. (used to trigger some corrective action).
The second level is a control signal that can be used to halt a process (in switchgear) or, in extreme instances, to completely cut power to the offending piece of machinery. (depending on the policy of the equipment user). The second signal is typically associated with a critical density level at which the apparatus will not function.
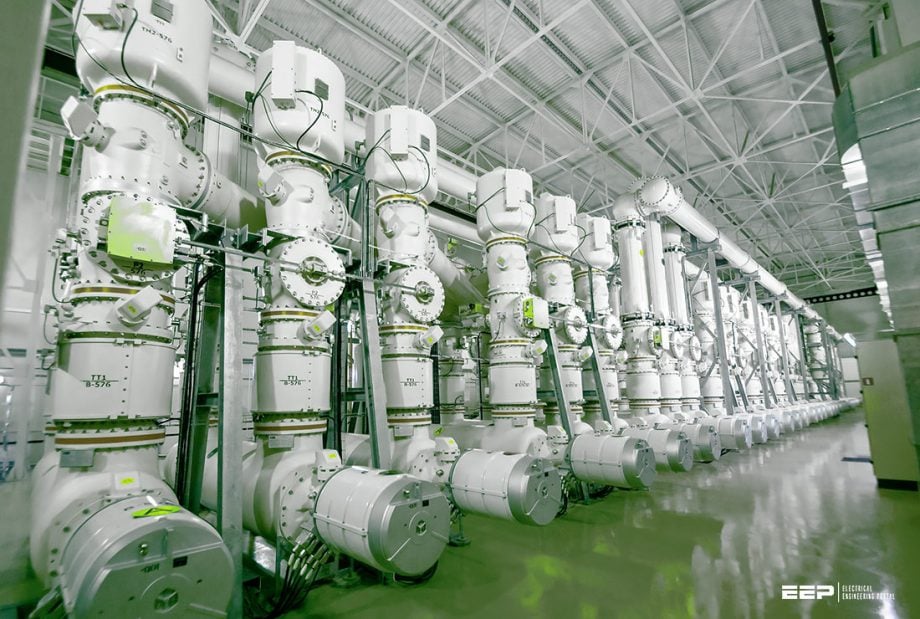
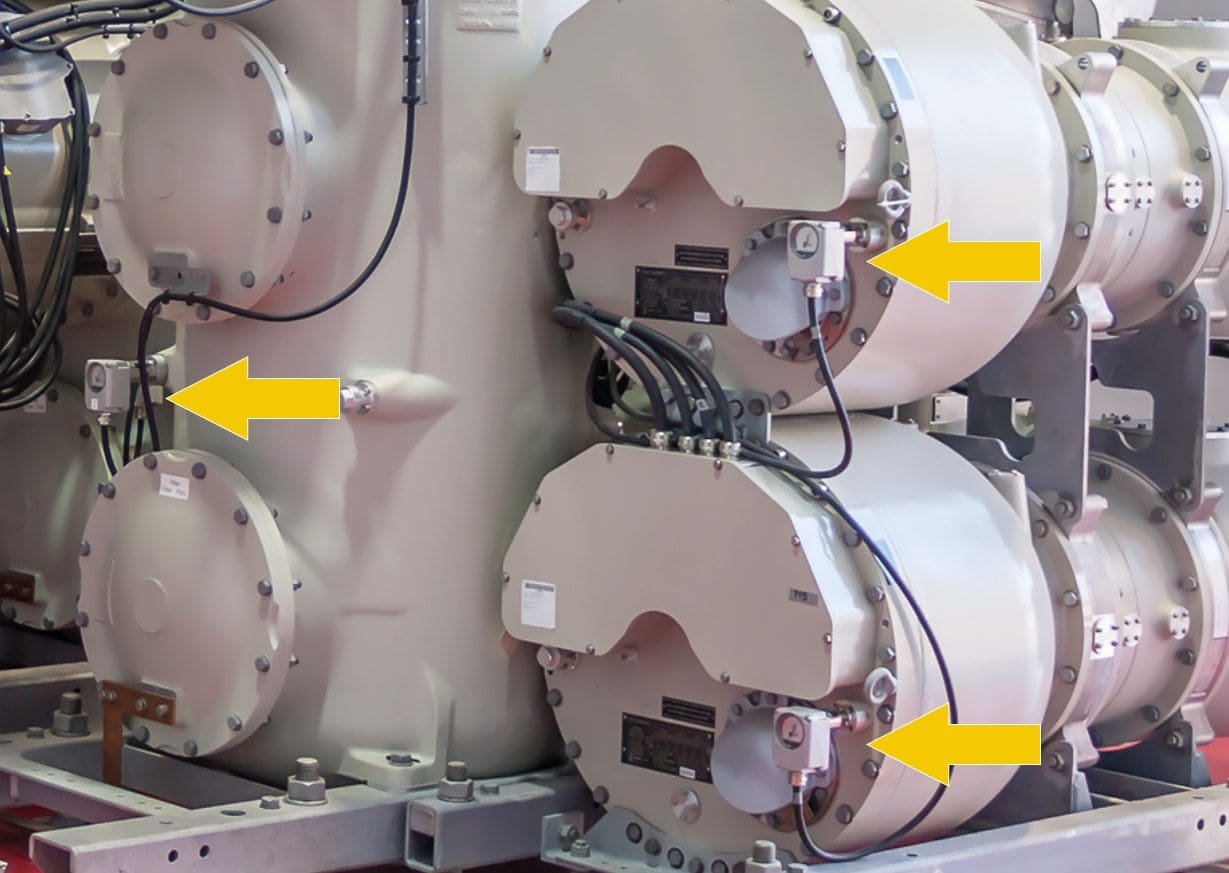
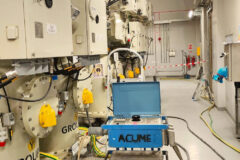
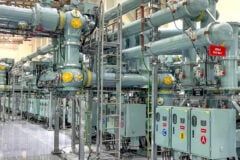
Figure 2 – Gas density monitoring system installed on 170kV feeder (click to zoom)
There are a variety of technological options for accomplishing these goals. Some examples are as follows:
Function #1 – Simple pressure switches
Pressure is not the same as density, hence this technique is only employed in devices with large safety margins, where the threshold pressures still guarantee enough gas density for appropriate operation despite the expected temperature difference.
These switches, calibrated to either of the aforementioned values, are used in several medium voltage devices.
Function #2 – Temperature compensated pressure gauges
To change the response of a pressure sensor, a separate temperature signal is used. These sensors often have a visible gauge (calibrated to read true pressure or compensated pressure), but signaling is accomplished by relays or switches set to the two density threshold levels.
Function #3 – Gas monitor with reference gas
Reference gas in a sealed chamber interfaces with the measured gas via a mechanical bellows. Since the measured gas and the reference gas are equally affected by temperature changes, the effect of temperature is nullified when the pressure is changed instead.
In response to density-related pressure differentials, the bellows will trigger microswitches.
Function #4 – Direct measure of density
Changes in gas density alter the resonant frequency of tuning fork-based sensors. These sensors generate a continuous analog signal that measures density. In addition, the signal is interfaced with relays to provide threshold alarms.
Such systems have the potential to more precisely monitor and quantify minor gas leaks. However, this technique is not currently utilized in commercial systems.
Suggested Video – Fully integrated monitoring of partial discharge, SF6 and circuit breaker
Go back to the Contents Table ↑
1.1 Gas Monitoring Practices
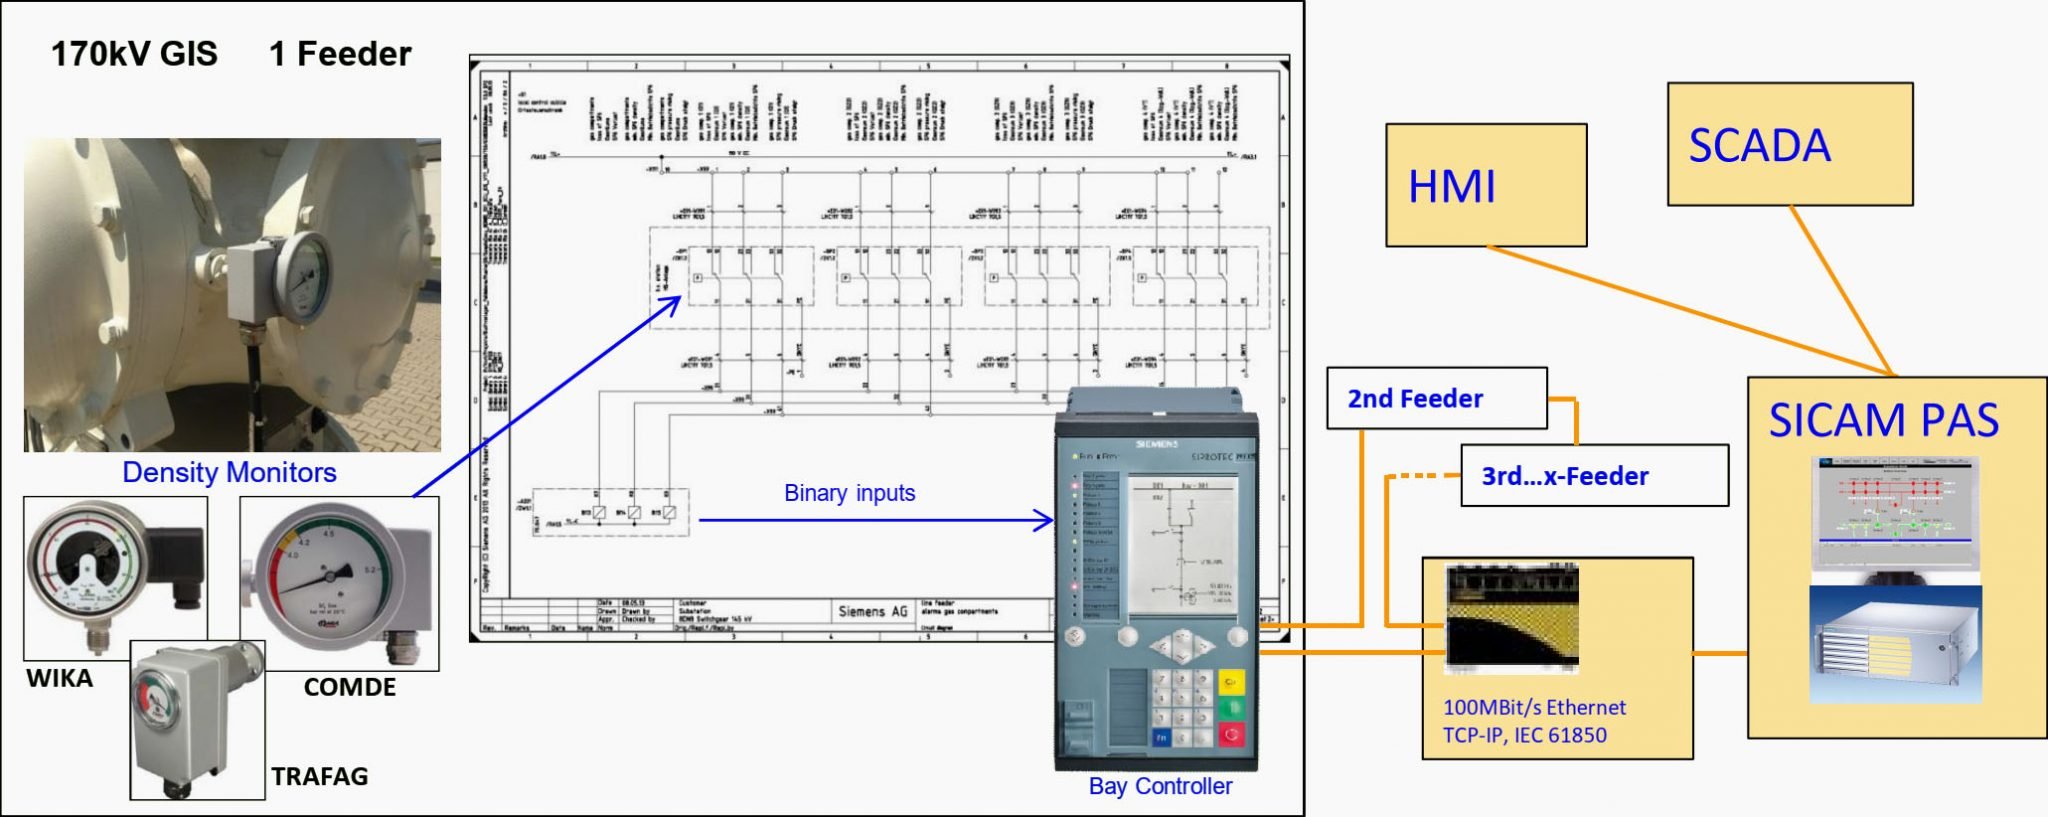
The “relay” kind of gas density monitors is the most common type used on GIS; these monitors use contact closures to indicate when predetermined gas density levels have been reached. Color-coded status indicators are commonplace on-device, but these do not provide a numerical value of density.
In most cases, low-gas alarms are the only form of monitoring for such gadgets. Indicator status can also be checked manually during inspections.
Such records could be kept manually, but only automated systems make it practical to do so. It is anticipated that automated techniques to record numeric values of density will become more frequent as the importance of maintaining SF6 inventory for environmental reasons grows.
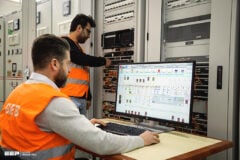
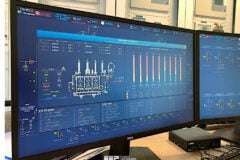
Figure 3 – An example of gas monitoring system with communications
Go back to the Contents Table ↑
2. Partial Discharge (PD)
Some forms of electrical insulation are susceptible to tiny electrical discharge events known as partial discharges (PDs). PD (at a low level) is nearly considered normal in some circumstances, especially with complex multicomponent apparatus. (e.g., in some types of rotating machine insulation).
However, in many instances, the existence of PD is indicative of degradation and an insulating fault. Gas-insulated switchgear (GIS) is, in theory, PD-free. Detection sensitivity constraints are taken into account in the real world.
Furthermore, some forms of low-level PD may not be significant within the typical lifetime of the equipment. As a result, PD boundaries over which acceptance tests will fail are commonly used. Any PD below this threshold is typically disregarded as being harmless to the machinery in the long run.
However, the goals shift slightly when viewed through the lens of monitoring. The insulation’s condition is assessed with the use of monitoring to see if substantial deterioration is occurring over time.
Important Questions That Need Answers!
When done properly, monitoring can assist in aswering the following questions:
- Is there a developing insulation problem?
- Where within the equipment is this problem occurring? What components are suspected?
- How severe is the problem? What are the consequences?
- How much time is available to address the problem?
The first question is about detection. Because GIS should, in theory, be PD-free, any detection of PD beyond a certain threshold is interpreted as an indication of a developing problem. However, detection must be followed by the second issue of location, particularly if the sources of the PD are known. PD from various components (for example, corona shields, insulators, and particles) should be read and evaluated differently.
If the source is recognized, an assessment of the severity may typically be given (although subjectively by an expert). The final question, about available time, would be very useful to many users (since it allows for planning), but it is the most difficult (almost impossible) to answer, especially when random processes are involved.
Practical objectives for most monitoring techniques would be detection and location, followed by some assessment and expert interpretation.
Testing On Site – Partial Discharge online testing of GIS 110kV Switchear
Go back to the Contents Table ↑
2.1 Defect Types in GIS Switchgear
In gas-insulated switchgear, there are several types of defects that could generate partial discharge.
Defect #1 – Metallic Particles
Particles are by far the most common sort of imperfection detected in GIS. Particles, on the other hand, are primarily an issue during commissioning because they are frequently introduced during the assembling process. Particles are less of a concern for in-service monitoring.
However, particles in relatively innocuous areas may be physically transported into more active parts on occasion due to vibration and other mechanical forces caused by breaker operation.
Furthermore, compartments with moving parts (switchgear) will occasionally develop their own particles over time due to wear, especially if there is a mechanical deficit (potential misalignment).
Unfortunately, the PD associated with such phenomena in the early stages can be quite modest and difficult to identify.
Figure 4 – General defect locations on GIS for different causes of PD (click to zoom)
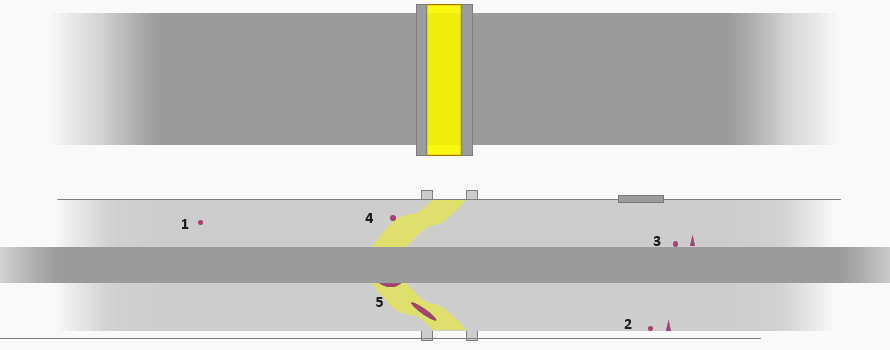
Where:
- Free moving/floating particles
- Protrusion and particles on housing
- Protrusion on conductor
- Particle or defect on insulator
- Defect in the insulator/delamination
Defect #2 – Floating Components
Shielding is used in many GIS designs internally to prevent damage to critical components. These shields need to be wired to either the main high voltage conductor or the grounded enclosure, whichever has the known potential. The contact is sometimes made with relatively weak mechanisms, such as springs, clips, or other devices.
Electrical contact can be lost (over time) if the contact is inadequate due to deterioration or contamination, leaving the shield at floating potential. Floating parts and other conductors frequently experience partial discharges. PD may be mild and intermittent in the beginning stages.
Insulators in the area may fail due to the frequent discharging, which can lead to local breakdown of the SF6 gas and the formation of corrosive byproducts. As the contact material erodes, the discharging can also create conducting and non-conducting particles.
Suggested Video – Sensitive partial discharge testing on gas-insulated switchgear with UHF 800
Defect #3 – Insulator Defects
Small manufacturing problems, like as voids, could be present in the insulator but went undetected during quality control or testing. Failure due to such faults is uncommon and usually occurs after some time in service, even if the PD is usually fairly tiny (otherwise it would have been recognized earlier).
The good news is that GIS companies have been working hard to boost their production quality, so errors like these are extremely uncommon. Premature failure can also be caused by other internal flaws, such as metallic contamination on the inside of a solid insulator.
PD may also arise if an insulator experiences damage during operation from factors like as abnormal external stresses or thermal stress.
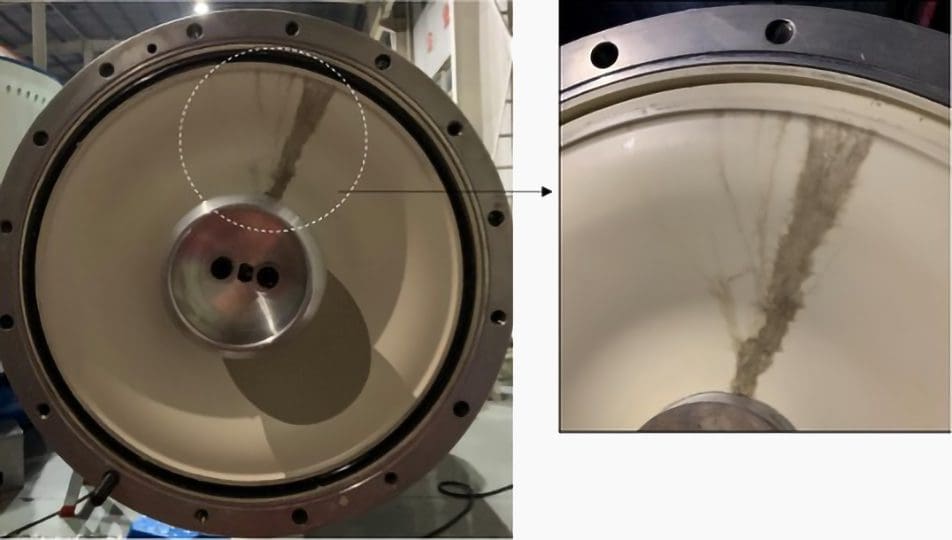
Figure 5 – Insulator defect
Go back to the Contents Table ↑
2.2 Partial Discharge (PD) Measurements
Measuring is essential for PD surveillance. It really is. The little electrical discharge of PD must be detected in order for measurements to be taken. Since PD is an electrical phenomenon, most of the methods used to measure it include electricity. However, acoustic energy will also be produced by the discharge, making acoustic PD techniques a viable option.
Electrical discharges can also degrade SF6 gas over time, with the resulting by-products being chemically detectable.
Modern advances have been made to better evaluate PD measurements by classifying PD signals on a pulse-by-pulse basis to distinguish between PD signals from different sources (including interference signals).
However, some monitoring systems may zero down on a less complex detection method in an effort to spot and signal the need for more advanced, human-performed assessments.
Suggested to Watch – Partial Discharge Measurement and Diagnosis of GIS
Go back to the Contents Table ↑
2.2.1 Ultrahigh frequency (UHF) Methods
The time span of the source’s partial discharge can be as short as 1-2 ns. Since GIS’s coaxial design can accommodate high-frequency signals, PD pulses may be detected accurately. However, the PD may suffer from attenuation and distortion (pulse broadening) as it travels through the system.
Ultrahigh frequency (UHF) techniques, with detection bandwidths of 1000 MHz or more, are capable of performing PD detection with a high degree of sensitivity. UHF techniques, however, may only be useful when the sensor is in close proximity to the defect source due to the considerable propagation loss experienced by the highest frequency components. (typically within 10–20 m).
Traditional approaches to PD measurement often employ a narrower bandwidth of around 100 kHz. These procedures, which are routinely employed on GIS components and some subassemblies, are completely documented in standards (IEC 60480). However, these techniques are less suited for large assemblies and field testing because of difficulties in achieving a decent signal-to-noise ratio.
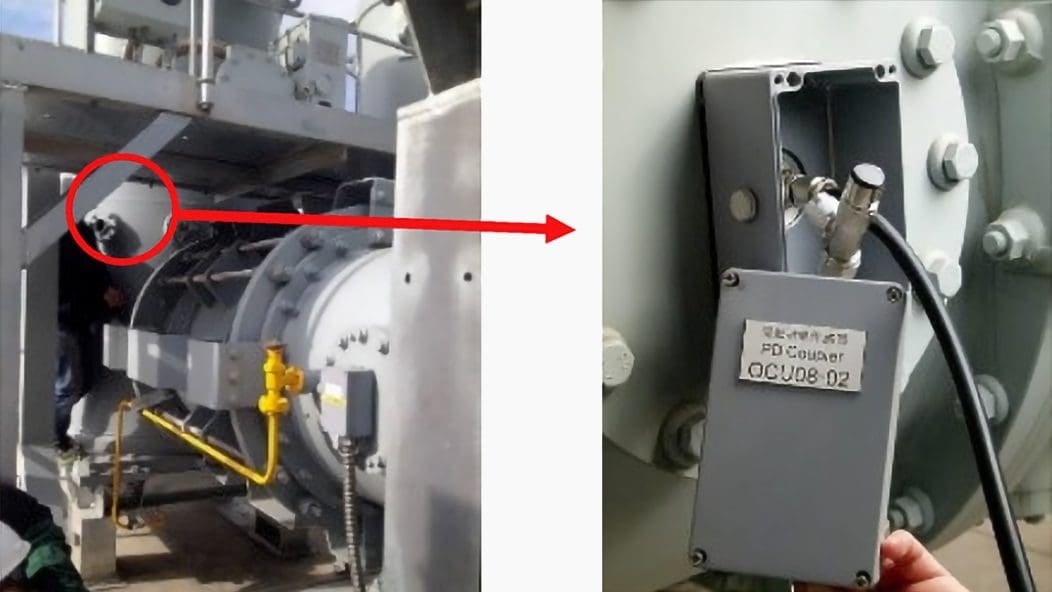
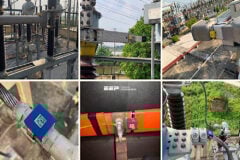
Figure 6 – Installation of Ultra-High-Frequency (UHF) sensors on 1100 kV Gas-Insulated Switchgear (GIS) in the field. Left: Overall installation; Right: Partial details.
Go back to the Contents Table ↑
2.2.2 Acoustic Methods
Micro-discharges caused by PD will not only send electrical signals, but also produce audible noise. Energy from the PD-generated acoustic waves in the SF6 gas will be transferred to the GIS enclosure, where they can be monitored by acoustic emission (AE) sensors.
It is challenging to link PD to typical electrical numbers using acoustic approaches. (such as pC). However, the method has been successfully employed to evaluate GIS in operational settings.
Since the strength of the signal does not necessarily correspond to the severity of the defect, acoustic PD readings will call for some interpretation on the part of an expert. For instance, acoustic signals are typically attenuated by the insulator, making it difficult to detect discharges that occur within solid insulation (such as in a void).
Suggested Video – On site Insulation Analysis for GIS using UHF and Acoustic PD Measurements
Go back to the Contents Table ↑
2.2.3 Chemical Techniques
When SF6 gas undergoes partial discharges, the gas decomposes and produces minute amounts of byproducts. Therefore, these by-products can serve as a “detection” for partial discharge. Due to the low by-product production rate, this method of detection is best used for in-service diagnostics and cannot be used as a quick test.
Measurable outcomes typically necessitate a prolonged time commitment (weeks, months, or even years).
Samples of SF6 gas can be taken and sent off to a lab for analysis, or measurements can be taken on the spot with handheld sensing equipment. The first technique is similar to the dissolved gas analysis of transformer oils. By-product concentrations down to a few ppm can typically be determined through laboratory analysis. (ppm).
Related Reading – The art of predicting the fate of a power transformer by looking into a cup of oil
The art of predicting the fate of a power transformer by looking into a cup of oil
Go back to the Contents Table ↑
2.3 PD Monitoring Approach
Due to the need for several, closely-spaced sensors to provide the maximum possible coverage of the GIS, full systems used for PD monitoring can be quite involved. Typically, GIS equipment includes electrical PD sensors in the form of specialized couplers (antennas). See Figure 7 below.
To strike a balance between sensitivity and affordability, it is advised that couplers be placed no further than 20 meters apart. The additional expense of including couplers in the design phase may be little, but retrofitting couplers onto already-existing machinery may be prohibitively expensive.
While there are dedicated, plug-and-play couplers that tap into the GIS system’s preexisting electrical openings (at insulated flanges, viewports, etc.), their response may be subpar at best. A bigger problem than the lack of couplers is the possibility of their being utilized for monitoring.
Each coupler could be:
- Permanently wired into a central measuring device. Owing to the distances involved and signal attenuation, measurement bandwidth might be limited.
- Permanently wired to a nearby local measuring device. Multiple measuring devices would be required for station coverage. In addition, a method of communication from each device to a central hub might also be required.
- Used with portable equipment. Monitoring is done manually at intervals determined by the user.
The comments above are generally applicable to electrical measurement-based monitoring systems.
Acoustic measurement-based systems have the same challenges, but because acoustic sensors may be put virtually anywhere on the exterior of the enclosure, acoustic systems are typically employed as portable equipment.
Figure 7 – Couplers used for PD detection in GIS
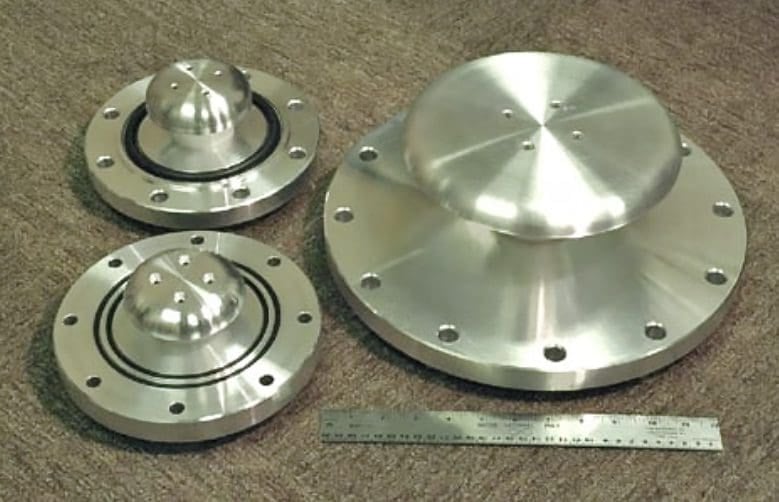
These couplers are designed to not compromise the insulation of the GIS and are adapted for various flange openings. Couplers are integrated into insulators and other devices in some designs (not shown).
A fully implemented monitoring system might be complicated and expensive. Implementation decisions are frequently influenced by the perceived value of the projected results as well as the cost/benefit at that specific installation. A comprehensive monitoring system may be required for the most important installations.
However, as current GIS equipment becomes more reliable, the need for PD monitoring decreases, and many users prefer not to use such systems.
Go back to the Contents Table ↑
2.4 Circuit Breaker Monitoring
Monitoring may be used in GIS that incorporate switchgear components such as circuit breakers. A variety of redundant circuit breaker monitors are commercially available, although they are not limited to GIS breakers. These devices range from basic add-ons to sophisticated systems with web-based user interfaces that are completely integrated into SCADA.
The majority of breaker monitoring systems are concerned with characteristics relating to contact wear or mechanical elements of breaker operation. The following are examples of typical monitored parameters:
- Operation counter
- Arc interruption time
- Breaker timing (open/close times) values
- Accumulated fault current (cumulative It or I2t)
Other functions, like as gas monitoring, may be integrated into the same package by some systems. Manufacturers will frequently provide a monitoring device with the breaker that users will incorporate (choose functions) into their operations.
However, for the greatest results, users should design their own criteria based on their own data and expertise, especially as operational conditions may differ from one user to the next.
Webinar – HV GIS: Fully integrated monitoring of partial discharge, SF6 and circuit breaker
Go back to the Contents Table ↑
2.5 Other Forms of Monitoring
In addition to the above, other forms of monitoring could be found in GIS. These could include:
1. Monitoring by video camera of disconnector and ground switch positions via viewports
Some users will use video imaging in viewports to confirm open/closed positions of switch contacts. This would be done in addition to other signals normally used with SCADA systems.
Suggested Guide – Design of a SCADA traffic monitoring system for T&D systems
Design of a SCADA traffic monitoring system for electricity transmission and distribution systems
2. Thermal monitoring (temperature, infrared) of GIS and conductor contacts
Although IR thermography might not be able to resolve contact problems on enclosed parts, general trends in temperature might be capable of detecting some forms of unusual heating patterns.
3. Monitoring of air ventilation systems for indoor installations
In some cases, SF6 detectors are used to monitor and automatically trigger forced ventilation in indoor installations. This approach addresses the case of enclosure burn-through or operation of pressure-relief devices (following an internal power arc fault), in which case a large quantity of SF6 gas and possible toxic decomposition by-products could be released into the ambient.
With modern technologies, the latter type of monitoring has become practical, with enormous potential to help the user. Such methods, however, are only valuable if time and effort are given in interpreting the information gathered.
Suggested Course – GIS Design, Installation, Operation & Maintenance, Testing
Gas-Insulated Switchgear Course: Design, Installation, Operation and Maintenance, Testing
Go back to the Contents Table ↑
Sources:
- GIS substations by H. J. Koch
- Gas Density Monitoring System (GDM) by Siemens
- A Study on The Development of a Novel Coupler for GIS PD Detection by Jaegu Choi, Kwanghwa Kim, and Iksoo Kim
Related electrical guides & articles


Edvard Csanyi
Hi, I'm an electrical engineer, programmer and founder of EEP - Electrical Engineering Portal. I worked twelve years at Schneider Electric in the position of technical support for low- and medium-voltage projects and the design of busbar trunking systems.I'm highly specialized in the design of LV/MV switchgear and low-voltage, high-power busbar trunking (<6300A) in substations, commercial buildings and industry facilities. I'm also a professional in AutoCAD programming.
Profile: Edvard Csanyi
