Calculations & Design Considerations
Hydropower plants, one of the major sources of energy in countries with an abundance of water resources, have unique generation and power evacuation characteristics. From mere kilowatts to thousands of megawatts, they come in every shape and size. In this article, the focus will be on the major steps of electrical design for generation and power evacuation in large run-of-river hydropower plants.

A sample project of capacity 105 MW serves the purpose of illustrating calculations and design considerations of a real-world example in this article. Hydropower plants are usually accompanied by loads of design and construction issues due to their remote and bucolic locations.
Steps discussed in this article are major parts of a feasibility study and detail design, which resemble major building blocks of a complete design. A feasibility study lays a foundation for preliminary appraisal, and decision-making based on initial observations.
Other factors related to the environmental impact study, hydrological data, and site selections, also a part of preliminary study, precede the electrical study and lay a foundation for the overall design.
- Generation Capacity and Unit Selection
- Voltage and Conductor Selection
- Generator
- Main Transformer
- Switchgear and Protection
- Power Evacuation Transmission Line
- Design Assimilation
1. Generation Capacity and Unit Selection
The selection of optimum project size depends upon the probability of minimum flow available. The hydrological study assesses rainfall patterns and predicts the design discharge, mean monthly flow, and flow duration curve, which are essential for determining the feasible generation capacity.
In the case of the sample project in this article, based on available design discharge of 16.7 m3/s and gross head of 800m, the possible power generation capacity is calculated as:
P = η × ρ × g × h × Q Watts = 104.64 MW. (105 MW)
Where:
- η is the total system efficiency, ( taken 0.82 for this case)
- ρ is the density of water, taken as 998 kg/m³
- g is the acceleration of gravity, equal to 9.81 m/s²
- h is the head in meters.
- Q is the discharge in m3/s.
Table 1 – Annual discharge data of river and corresponding generation power
| Months | Avg River Discharge (m3/sec) | Environmental Discharge (m3/sec) | Avg Plant Dischage (Q)m3/s | Net Head (m) | Plant efficiency (n) | Water density (kg/m3) | Average Power output (W) |
| Apr/May | 8.17 | 0.16 | 8.01 | 793 | 0.82 | 998 | 41,380,901.24 |
| May/Jun | 10.66 | 0.16 | 10.5 | 790 | 0.82 | 998 | 66,593,185.72 |
| Jun/Jul | 35.00 | 0.16 | 16.7 | 780 | 0.82 | 998 | 104,574,181.70 |
| Jul/Aug | 39.00 | 0.16 | 16.7 | 780 | 0.82 | 998 | 104,574,181.70 |
| Aug/Sep | 27.00 | 0.16 | 16.7 | 780 | 0.82 | 998 | 104,574,181.70 |
| Sep/Oct | 27.50 | 0.16 | 16.7 | 780 | 0.82 | 998 | 104,574,181.70 |
| Oct/Nov | 14.36 | 0.16 | 14.2 | 790 | 0.82 | 998 | 90,059,355.93 |
| Nov/Dec | 10.46 | 0.16 | 10.3 | 792 | 0.82 | 998 | 65,490,123.19 |
| Dec/Jan | 8.36 | 0.16 | 8.2 | 793 | 0.82 | 998 | 52,203,598.49 |
| Jan/Feb | 7.66 | 0.16 | 7.5 | 794 | 0.82 | 998 | 47,807,404.58 |
| Feb/Mar | 6.36 | 0.16 | 6.2 | 794 | 0.82 | 998 | 39,520,787.78 |
| Mar/Apr | 5.66 | 0.16 | 5.5 | 795 | 0.82 | 998 | 35,102,917.97 |
The table above illustrates the comparison of river discharge available throughout a year in different months, along with their comparison with design discharge. In this case, the design discharge criteria of 16.7 m3/sec are met for only around four months in a year and for the rest of the time, the generating station operates in a partial capacity.
The focus of the design engineer must be on optimizing all these factors to maximize the energy generation from available discharge.
Go back to the Contents Table ↑
1.1 Design Considerations for Generating Unit Selection
- In the dry season, the unavailability of rated discharge requires the plant to operate in partial capacity (operating less number of generating units) to obtain higher efficiency and limit the losses.
- The higher the number of units requires more space and auxiliary requirements for the instalment, which results in the overall cost increment of the project.
- The higher the number of units requires higher maintenance cost and running cost as it leads to higher losses.
- On its advantage, the higher the number of units facilitates easy redundancy during maintenance, thus reducing the probability of power interruptions.
Go back to the Contents Table ↑
1.2 Sample Calculation for Part Flow Efficiency of Turbines
Part flow available for unit turbine = Available discharge/ (Design discharge / No. of units)
For minimum available discharge of 5.5 m3/sec in the month of Mar/ April,
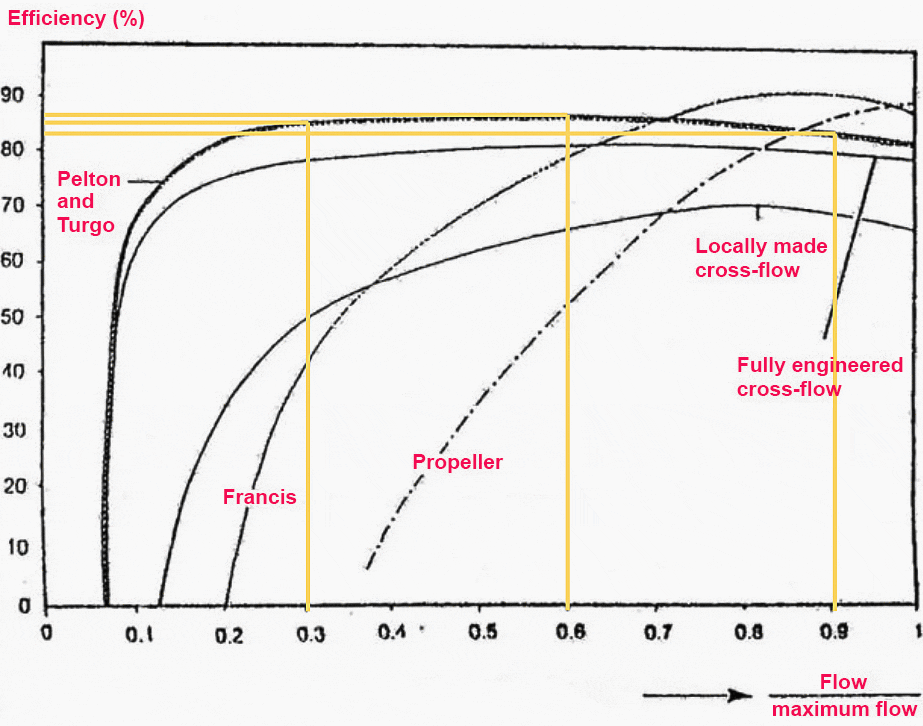
Option 1 – Number of Generating Unit-1: Part flow = 5.5/(16.7/1) = 0.33
Option 2 – Number of Generating Unit-2: Part flow = 5.5/(16.7/2) = 0.66
Option 3 – Number of Generating Unit-3: Part flow = 5.5/(16.7/3) = 0.99
Figure 1 – Part flow efficiency comparison of probable turbine types


Go back to the Contents Table ↑
1.3 Decision
Figure 1 illustrates the part flow efficiency of the most commonly used turbine types. For the above sample calculations, the most efficient part flow percentage for the Pelton turbine seems to be 0.66, option 2, which yields maximum turbine efficiency of around 85%.
Thus, the most efficient option would be opting for two generating units of 52.5 MW each. However, other factors of accessibility and transportation must be well assessed before the final decision.
Design engineers must be able to contemplate between the plant efficiency and other constraints to choose the best possible option, based on the individual case of each project.
Table 2 – Most popular turbine types with a respective operating head range
| Turbine | Head Range in meters |
| Kaplan and Propeller | 2<H<40 |
| Francis | 10<H<350 |
| Pelton | 50<H<1300 |
| Michell-Banki | 3<H<250 |
| Turgo | 50<H<250 |
Go back to the Contents Table ↑
2. Voltage and Conductor Selection
Choice of the most appropriate Voltage level is heavily dependent on the estimated generation capacity and location of the nearest hub for evacuation. For the given condition of 105 MW of generation capacity and 45 km of estimated line length, sample calculation for most economical voltage choice and most efficient conductor selection is illustrated below.
The most economical voltage calculation:


