
Estimated Study Time: 6 minutes
Nation’s energy
About 82% of the nation’s energy comes from fossil fuels, 8% from nuclear, and 9% from renewable sources. Wind is the fastest growing renewable source, but contributes only 1% of total energy used in the U.S.
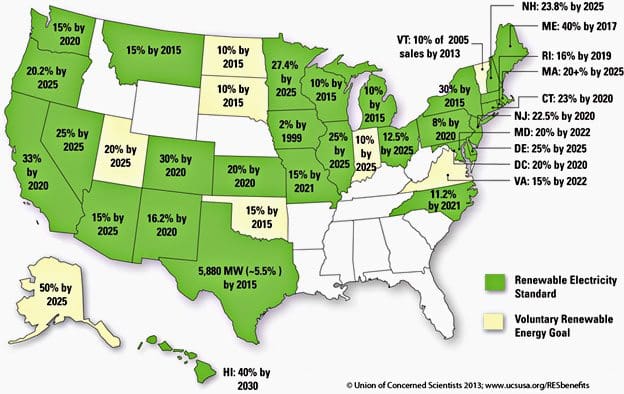
The examples below illustrate the progress and potential of U.S. renewable energy:
Wind Resources
U.S. onshore wind resources have the potential to generate almost 10,500 GW of electricity, 175 times more than the current installed capacity of 60 GW.
Based on the average U.S. electricity fuel mix, a one MW wind turbine can displace 1,800 tons of CO2 emissions per year. With a wind power capacity of 300 GW, 825 million metric tons of CO2 emissions could be avoided annually.
Wind turbines emit no emissions in producing electricity but are not without impacts, such as bat and bird kills, land use, noise pollution, and aesthetics.
Installed Wind Capacity, Top 5 Countries, 2012
Solar Resources
Assuming intermediate efficiency, solar photovoltaic (PV) modules covering 0.6% of U.S. land area could meet national electricity demand.
The cost of PV modules, a large part of system cost, fell 62% from 2008 to 2011. U.S. market share of cell and module production dropped from 30% to 7% between 2000 and 2010.
The U.S. Department of Energy’s SunShot Initiative aims to reduce the price of solar energy 75% from 2010 to 2020, which is projected to lead to 27% of U.S. electricity demand met by solar technology and a 28% decrease in electricity sector greenhouse gas emissions by 2050.
While solar PV modules produce no emissions during operation, toxic substances (e.g., cadmium and selenium) are used in manufacturing PV technologies.
U.S. Photovoltaic Installations, 2000-2012
Biomass Resources
Wood, mostly as pulp, paper, and paperboard industry waste products, accounts for 46% of total biomass energy consumption. Waste—municipal solid waste, landfill gas, sludge, tires, and agricultural by-products—accounts for an additional 11%.
Biomass has low net CO2 emissions in comparison to fossil fuels. At combustion, it releases only the CO2 it previously removed from the atmosphere, although additional emissions are associated with processing, but it requires 124 acres of land to generate one GWh of energy per year.12
U.S. ethanol production is projected to reach 37 million gallons per day in 2040.
U.S. Biomass Consumption: Historic and Projected
Geothermal and Hydrothermal
Hydrothermal resources, i.e., steam and hot water, are available primarily in the western U.S., Alaska, and Hawaii, yet geothermal heat pumps can be used almost anywhere to extract heat from the shallow ground, which stays at relatively constant temperatures year-round.
U.S. geothermal power offsets the emission of 22 million metric tons of CO2, 200,000 tons of nitrogen oxides, and 110,000 tons of particulate matter from coal-powered plants each year. Some geothermal facilities produce solid waste such as salts and minerals that must be disposed of in approved sites, but some byproducts can be recovered and recycled.
Geothermal Installed Capacity, Top 5 Countries, 2010
Hydroelectric Power
In the U.S., net electricity generation from conventional hydropower peaked in 1997 at 356 TWh. After a decade of production well below 300 TWh, electricity generated from hydropower reached 325 TWh in 2011.
Other environmental concerns include fish injury and mortality, habitat degradation, and water quality impairment.
“Fish-friendly” turbines and smaller dams help mitigate some of these problems.
Hydropower Electricity Generation, 2012
Reference: Center for Sustainable Systems, University of Michigan. 2013. “U.S. Renewable Energy Factsheet.” Pub. No. CSS03-12
Related electrical guides & articles


Edvard Csanyi
Hi, I'm an electrical engineer, programmer and founder of EEP - Electrical Engineering Portal. I worked twelve years at Schneider Electric in the position of technical support for low- and medium-voltage projects and the design of busbar trunking systems.I'm highly specialized in the design of LV/MV switchgear and low-voltage, high-power busbar trunking (<6300A) in substations, commercial buildings and industry facilities. I'm also a professional in AutoCAD programming.
Profile: Edvard Csanyi
