Energy-Saving Opportunities
Electricity is a powerful form of energy that is essential to the operation of virtually every facility in the world. It is also an expensive form of energy that can represent a significant portion of a manufacturing facility’s cost of production.
This energy management primer is intended to introduce some electricity billing fundamentals, especially focusing on the two major aspects of the electricity bill, demand and energy.
Most electric utilities serve a designated geographic territory, largely without other competitors having access to their customers. As such, utility prices have often been set by local, state, or federal regulators, entities that review electric utility costs, revenues, investment decisions, fuel prices, and other factors to arrive at a target rate of return.
This approved rate of return, coupled with the utility’s cost structure, determine prices customers will pay.
These prices are established in electric utility tariffs, or rate schedules. Rate tariffs are usually established for different classes or sizes of customers. Common class types may include industrial, commercial, residential, municipal, and agricultural. Each customer class may have one or more rate schedules available, and it is common for the electric utility to allow a facility to choose the rate schedule within its class that offers the lowest price.
So, let’s go through each of 5 key elements of your electricity bill:
- Electricity metering
- Demand
- Energy consumption
- Load factor – Demand / Energy relationship
- Power factor
1. Electricity metering
Electric utilities meter both the real and reactive power consumption of a facility. The real power consumption, and its integral – energy, usually comprise the largest portion of the electric bill.
Reactive power requirements, usually expressed in power factor, can also be a significant cost.
2. Demand
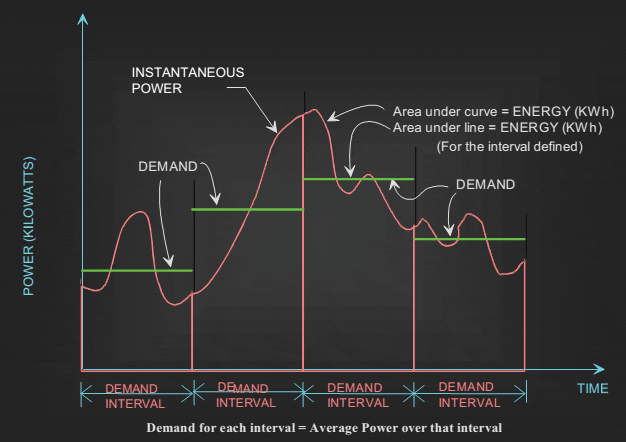
Real power consumption, typically expressed in kilowatts or megawatts, varies instantaneously over the course of a day as facility loads change. While instantaneous power fluctuations can be significant, electric utilities have found that averagepower consumption over a time interval of 15, 30, or 60 minutes is a better indicator of the “demand” on electrical distribution equipment.
The demand rate, in $/kW, may also be referred to as a capacitycharge, since it has historically been related to the necessary construction of new generating stations, transmission lines, and other utility capital projects. Demand charges often represent 40% or more of an industrial customer’s monthly bill.
“Demand” is the average instantaneous power consumption over a set time interval, usually 15, 30, or 60 minutes.
3. Energy consumption
The other major component of an electric bill is energy. The same metering equipment that measures power demand also records customer energy consumption. Energy consumption is reported in kilowatt-hours or megawatt-hours. Unlike power demand with its capacity relationship, customer energy consumption is sometimes related to fuel requirements in electric utility generating stations.
4. Load factor – Demand / Energy relationship
One useful parameter to calculate each month is the ratio of the average demand to the peak demand. This unit-less number is a useful parameter that tracks the effectiveness of demand management techniques. A load factor of 100% means that the facility operated at
the same demand the entire month, a so-called “flat” profile. This type of usage results in the lowest unit cost of electricity.
Few facilities operate at a load factor of 100%, and that is not likely to represent an economical goal for most facilities. But a facility can calculate its historical load factor, and seek to improve it by reducing usage at peak times, moving batch processes to times of lower demand, and so forth.
LF = kWh / (kW * days * 24)
Where LF is Load Factor, kWh is the total energy consumption for the billing period, kW is the peak demand set during the billing period, and days is the number of billing days in the month (typically 28-32). “24,” of course is the number of hours in a day.
Time-of-Use customers may prefer to track load factor only during on-peak time periods.
In that case, the kWh, kW, days, and hours/day in the formula are changed to reflect the parameters established only during the onpeak periods.
Typical load factor for an industrial facility depends to a great degree on the number of shifts the plant operates. One shift, five-day operations typical record a load factor of 20-30%, while two-shifts yield 40-50%, and three shift, 24/7 facilities may reach load factors of 70-90%.
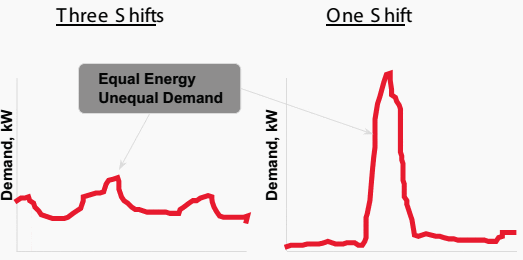
demand for the one shift facility is much less than one
| Load Factor | 30% | 50% | 70% |
| Peak Demand, kW | 1142 | 685 | 489 |
| Energy Usage, kWh | 250,000 | 250,000 | 250,000 |
| Demand Cost | $11,420 | $6,850 | $4,890 |
| Energy Cost | $10,000 | $10,000 | $10,000 |
| Total Monthly Bill | $21,420 | $16,850 | $14,890 |
| Average Cost/kWh | 8.57 | 6.74 | 5.96 |
| Demand Cost As Percent of Total | 53% | 41% | 33% |
5. Power factor
The relationship of real, reactive, and total power has been introduced previously, and described as the “power triangle”. For effective electricity cost reduction, it is important to understand how the customer’s electric utility recoups its costs associated with reactive power requirements of its system.
Even if a utility does not charge directly for poor power factor, there are at least three other reasons that a customer may find it economical to install equipment to improve power factor within its facility, thereby reducing the reactive power requirements of the utility.
Typical energy auditing process
- Evaluate the current rate schedule
- Determine if other rate schedules are available
- Complete the Facility Energy Profile
- Assess no-cost/low-cost energy saving options
- Complete feasibility analysis of energy management project options
- Recommend Energy Action Plan
Example of Electricity bill
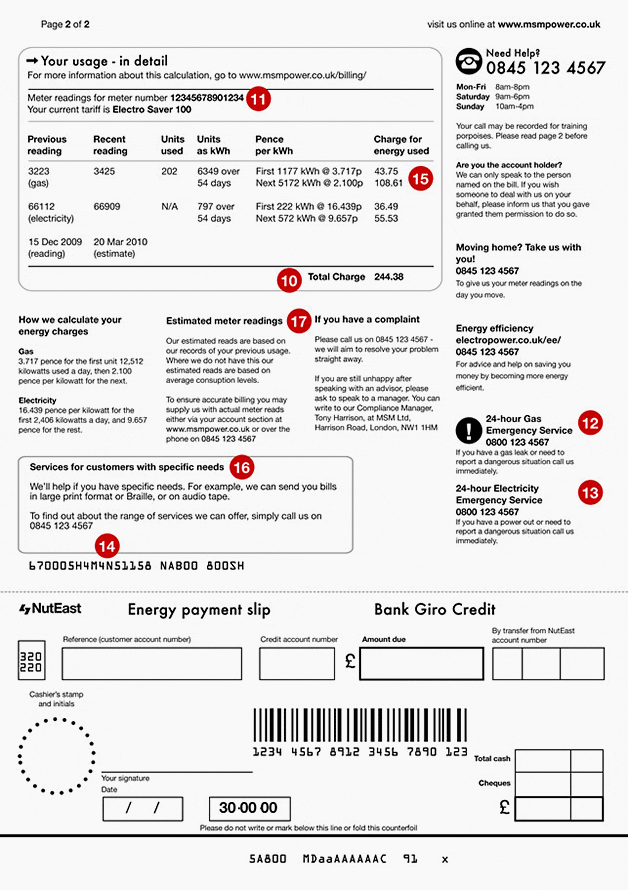
Reference: Electrical Energy Management – Bill Brown, P.E., Square D Engineering Services


very precious and useful information ,it helps me a lot thank you !
You’re welcome Asmaa!
I always get helpful practical information on this site, please keep up the good work.
nice article , will love to get more from you …
thanks…
Yours sincerely ,
CO ANAMWEST NIG LTD
Please let me know voltage level of distribution network in Houston US . What is the system to fed electricity in residential houses.
Good information for electrical engineers
Very very useful information I like most . Many many thanks for providing such information. Keep it up . Doing good job.
Good job,great articles
let me know about power saver (indian standard) which after installation will reduce watts
It is very usefull for me , it gives u the review as well as some imp points and tricks about the electrical engineering.
how can i download this article in pdf format..please create an EEP application for windows operated mobiles..
Print page to PDF. Most microsoft office products have XPS pdf options. There are also extensions for chrome and firefox to save pages as PDF
in the table the (Energy Usage, kWh) is 342