
Estimated Study Time: 43 minutes
Transformer measurements
Transformer life management requires a portfolio of the different kinds of on-site electrical tests to be performed. This is where things get complicated. The purposes for performing these tests include fingerprint measurements of new transformers to characterize the initial status, routine tests (periodic checks) for observing trends, monitoring as an early “warning system”, and tests for troubleshooting and fault location.
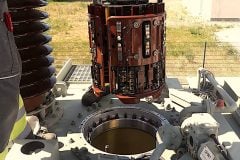
 On-site transformer diagnostic measurements: The art of troubleshooting and maintenance (on photo: Maintenance engineer preparing connections for performing dielectric frequency response (DFR) analysis)
Sometimes it is hard for maintenance engineers to correctly interpret contradictory data taken from various transformer measurements. This could potentially lead to making bad decisions which could cost a lot, and this is something that should be avoided.
This technical article presents a breakdown of the most important standard and special on-site transformer tests and measurements along with a short explanation of the test method, detectable failures, failure indication, reference and correct interpretation of measurement results.
The main targets of on-site tests are:
- Control of the ageing performance of insulating oil and the solid insulation due to dielectric and thermal aging.
- Discrimination of failure type as thermal or dielectric.
- Measurement, localization and assessment of partial discharge activity.
- Control of mechanical changes due to dynamic impacts.
- Trending of moisture absorption and ageing of both the liquid and the solid insulation.
- Basic Transformer Measurements:
- Special Transformer Measurements:
- Frequency Response Analysis (FRA)
- Polarization/Depolarization Current (PDC) Method Detectable Failures
- Frequency Domain Spectroscopy (FDS)
- Electrical Method for Partial Discharge (PD) Measurement
- Acoustic Partial Discharge (PD) Measurement
- Partial Discharge (PD) Measurement using UHF Technology
- Frequency Response of the Stray Losses (FRSL)
- Recovery Voltage Method (RVM)
- Summary Table
1. Basic Transformer Measurements
1.1 Winding Ratio
Detectable Failures: – Shorted winding sections or turns.
Indication: – Buchholz relay tripping OLTC repair.
Test Method: An AC source is connected to each phase of the HV winding with all other windings open-circuited. The source voltages across the HV winding and across the LV winding are measured.
Reference: Test report or rating plate, comparison of phases.
Interpretation: Measurement should be ± 0.5% of the nameplate values.
Comments and Suggestions:
- Some test equipment may allow magnetising current to be measured concurrently.
- Avoid performing winding resistance tests before the winding ratio measurement is carried out. The residual flux could impact the measurement.
- The ratio test is normally performed following internal work on the transformer involving disconnections of any leads, especially the OLTC.
Suggested Reading – My worst experience in testing and commissioning power transformers (and how I fixed things up)
My worst experience in testing and commissioning power transformers (and how I fixed things up)
Go back to the Contents Table ↑
1.2 Winding Resistance
Detectable Failures: Contact problems on the tap selector, contact problems on the diverter switch, broken conductors, broken parallel strands, shorted winding disks, shorted winding layers, poor bushing connections.
Indication: High internal temperatures, normally indicated by the DGA.
Test Method: A constant current source is used to feed a DC current into the winding. The test current and the voltage across the winding are measured and the resistance value is calculated.
It is recommended to measure the resistance for all taps of the OLTC. The resistance values should be corrected to 75°C according to IEC 60076 Part 1.
Reference: Test report of the manufacturer, fingerprint measurements.
Interpretation: The measured winding resistance should not differ more than about 1% compared to the factory test report if the winding temperature at measurement conditions is corrected to the factory conditions.
Difference between phases usually less than 2-3%. Comparison between HV and LV resistance is usually in the order of the square of the winding ratio when losses are balanced between HV and LV.
Comments and Suggestions:
In comparison to the LV winding, the resistance of the HV winding is much higher. Therefore identification of contact problems can be less sensitive on the HV side than the LV side.
Suggested Guide – Measurements Of Transformer Winding Resistance For Diagnostic Purposes
Measurements Of Transformer Winding Resistance For Diagnostic Purposes
Go back to the Contents Table ↑
1.3 Magnetising Current
Detectable Failures:Core faults (shorted laminations), shorted turns or winding parts.
Indication:Buchholz relay tripping or DGA.
Test Method:An AC source is connected to each phase of the HV winding with all other windings open-circuited. The source voltage across the HV winding and the source current are measured. If possible, the phase angle should also be measured.
Reference:Comparison of phases, fingerprint measurements.
Interpretation:Normally the outer phases have similar values within 5%. The current in the middle phase can be up to 30% lower.
Comments and Suggestions:
- Some test equipment may allow the winding ratio to be measured concurrently.
- Magnetising current at rated voltage is only 0.1 – 0.3 % of rated current. Voltage dependency of magnetising current means comparison testing must use the same test voltage and tap position.
- Avoid performing winding resistance tests before the magnetising current measurement is carried out. The residual flux could impact the measurement.
Go back to the Contents Table ↑
1.4 Capacitance & Dielectric Dissipation (Power) Factor
Detectable Failures:
- Capacitance: Winding to winding: change of the geometry between windings due to high currents or mechanical damage.
- Winding to ground: change of the geometry between winding and ground due to high currents or mechanical damage.
- Core to ground: change of the core position to the tank due to mechanical damage
- Condenser bushings: breakdowns between grading layers
- Dielectric Dissipation Factor or Power Factor: Insulation failures, contamination of insulation liquids with particles, acids, water in solid and liquid insulation, partial discharges due to bad contacts on bushing test tap, breakdown in bushing condenser layers.
Indication: Moisture, tests on regular bases (e.g. on high voltage bushings).
Test Method: A sinusoidal HV AC source (preferable with variable frequency) is connected to the test object in parallel to a low loss reference capacitor.
The following figure shows the equivalent parallel circuit of an insulator (capacitance) with its losses (resistance) and the comparative definitions of Dissipation Factor (DF) and Power Factor (PF), expressed as a ratio of currents in the equivalent circuit components.
For historical reasons, European countries mostly use DF, whereas PF is mostly used in North America. For values up to 10%, the typical range for insulating material, DF and PF are numerically equivalent anyway.
Figure 1 – Insulation equivalent circuit and Definitions for DF and PF

This test method, and its result, may be referred to by many terms such as loss factor, loss angle, dielectric loss angle (DLA), tan δ, tangent delta, δ, dielectric dissipation factor (DDF), dissipation factor (DF), power factor (PF), Cos φ or Cos θ.
The units of measure can also vary: radians, milli-radians (mR), %, 0/00 (rarely used). The absence of units usually means the result is the arithmetic value of cos φ or tan δ.
Reference: Test report, fingerprint measurements, trend analysis, comparison to identical units Nameplate values for bushings.
Interpretation: For measurements on windings, values are normally in the order of 0.5%. A measurement higher than 1% is questionable. For bushings, the following values are given in IEC and IEEE standards:
Table 1 – DF and PF values for bushings according to IEC 60137 and IEEE C.57.19.01
| Type | RIP | OIP | RBP |
| Insulation | Resin impregnated paper | Oil impregnated paper | Resin bonded paper |
| DF tan δ (RT) by IEC 60137 | < 0,7% | < 0,7% | < 1,5% |
| PF cos φ (RT) by IEEE C.57.19.01 | < 0,85% | < 0,5% | < 2% |
| Typical new values | 0,3-0,4% | 0,2-0,4% | 0,5-0,6% |
Note that all values are measured at 50/60 Hz and 20°C.
Comments and Suggestions: This is the most common technique for assessing the bushing condition (more information below).
Suggested Reading – Power Transformer Capacitance and Dissipation Factor Test
Go back to the Contents Table ↑
1.4.1 Additional Information for Bushing Diagnostics
The most common technique for assessing the condition of a bushing is the dissipation factor (DF) / power factor (PF) and capacitance measurement. Test results are then compared to nameplate values or previous tests. Increases or decreases from reference values are usually an indication of contamination and/or deterioration of the insulation system.
The temperature of the insulation can affect the dissipation / power factor results. Temperature correction factors for OIP and RIP bushings are shown below in Figure 2. The temperature of the bushing lies between the oil temperature of the transformer and the ambient temperature. The temperature of the oil and the ambient temperature should be recorded in the test report.
Figure 2 – Effect of Temperature on Dissipation / Power Factor (tanδ) Measurement
Leakage currents across the surface of the outer insulator (porcelain or silicone) may also have some influence, particularly if the surface is dirty and wet. In case of unexpectedly high dissipation / power factor values, the bushing should be cleaned before the measurement is repeated. For silicone composite bushings, the cleaning instructions of the manufacturer should be followed, because some cleaning chemicals can damage the silicone.
Additionally, a collar which is connected to the guard circuit can be used to suppress the influence of the surface current. With a “hot-collar”, the capacitance and dissipation / power factor of the insulation between the collar and the grounded centre conductor can be measured.
This technique can be used to detect local faults in bushings or low oil level in oil-filled bushings.
All given reference values are valid for the capacitance “C1”, which lies between the inner conductor and the measuring tap. In oil-filled bushings, the dielectric losses of the capacitance “C2”, which lies between the measuring tap and the flange, can give some information about the oil around the active part of the bushing.
The bushings are sealed and leak tested at the time of manufacturing. In order to take an oil sample, the bushing has to be opened and this introduces a risk of improper re-sealing and possible contamination (moisture, dust) after sampling is completed. It is therefore recommended not to sample oil on bushings.
However, when a problem is known, for example, high dissipation/power factor for the C1 measurement, there might be a need for oil sampling and gas analysis. The interpretation of the analysis is done according to IEC 61464. If questions remain, the manufacturer can usually assist with the evaluation.
If oil needs to be sampled the following recommendations should be followed:
- Ask the original manufacturer for a sampling procedure.
- The sample is preferably taken during dry weather conditions.
- If this is not possible, clean the area around the sampling plug, and also protect that area from rain.
- The internal pressure of the bushing must not be altered before and after the sampling. This requirement is satisfied if the sample is taken when the mean temperature of the bushing is between 0°C and 30°C.
- The time when the bushing is open should be as short as possible.
- Immediately replace the removed oil with an equal amount of new, dry, degassed transformer oil.
- The gasket should always be replaced when the bushing is re-sealed.
Because bushings are hermetically sealed components, measuring the pressure of the oil within the oil-filled bushing is a valuable diagnostic tool. The advantage is that it allows monitoring of the online condition of the bushing to detect possible oil leakage or overheating.
However, this requires the bushing to be installed already equipped with a pressure sensor at the foot of the bushing.
Suggested Video – Diagnosing HV Bushings by OMICRON
Go back to the Contents Table ↑
1.5 Leakage Reactance (Short-Circuit Impedance)
Detectable Failures: Deformation of windings.
Indication: High through current faults, high inrush currents, Buchholz relay tripping, protective relay tripping.
Test Method: An AC source (preferable with variable frequency) is connected to each phase of the HV winding with the corresponding LV winding short-circuited. The source current and the voltage across the HV winding are measured to determine the leakage impedance.
Reference: Fingerprint measurements (one phase test), or comparison to identical units.
Interpretation: The measured impedance should not differ more than 2% compared to the factory test report.
The difference between phases is usually less than 2%. Changes >1% ought to be investigated with other tests such as FRA. Care is required comparing 3 phase and 1 phase test measurements.
Comments and Suggestions: The test can be done also from the LV side, but in this case, the values have to be corrected using the square of the winding ratio.
Suggested Reading – Load flow and short circuit analysis of a MV substation (case study 33/11 kV substation in ETAP)
Load flow and short circuit analysis of a MV substation (case study 33/11 kV substation in ETAP)
Go back to the Contents Table ↑
1.6 Insulation Resistance
Detectable Failures: Insulation deterioration or failures in the windings or core earthing.
Indication: Buchholz relay tripping, DGA.
Test Method: A high DC voltage (typical values are 1kV up to 5kV) is applied to the winding under test. The insulation between the core and tank can also be verified by this measurement. The leakage current is measured and the insulation resistance calculated and indicated by the instrument.
Reference: Test report, fingerprint measurements, comparison to identical units.
Interpretation:
- Transformers with rated voltage > 69kV, >1GΩ measured at 20°C
- Transformers with rated voltage ≤ 69kV, >500MΩ measured at 20°C
Comments and Suggestions:
Another way of applying Insulation Resistance is to measure the Polarization Index (PI) by measuring the current after 1 and 10 minutes of voltage application. The PI was introduced to detect moisture in the winding insulation of rotating machines. For the complex oil-cellulose insulation system of transformers, the PI results can be misinterpreted. FDS/PDC measurements are preferred for quantitative assessments of the moisture in the insulation.
The measurement of the insulation resistance can influence RVM, PDC and FDS measurements if they immediately follow the Insulation Resistance test.
Suggested Video – Insulation Resistance (IR) test of 3-phase distribution transformer
Go back to the Contents Table ↑
1.7 Core Grounding
Detectable Failures: Multiple core grounding by core grounding faults.
Indication: High internal temperatures, normally indicated by the DGA.
Test Method: The test can be done only if the core grounding can be disconnected outside the tank to measure the insulation resistance of the core to the ground.
Reference: Test report of the manufacturer, fingerprint measurements.
Interpretation: The insulation resistance of the core to the ground is in the order of 10MΩ or higher. Values lower than 100kΩ can indicate core grounding problems. In some cases, resistances are used to ground separated core lamination packets. These resistances are normally in the order of several kΩ.
Comments and Suggestions: Measurements of the core ground current in service, show that the measured current is in the order of some mA for a well-insulated core. If the core has grounding faults, the current is several amps or even higher.
Suggested Reading – The mystery of nuisance tripping incidents in transformer protection
The mystery of nuisance tripping incidents in transformer protection that worry engineers
Go back to the Contents Table ↑
2. Special Transformer Measurements
2.1 Frequency Response Analysis (FRA)
Detectable Failures: Shorted turns, core faults, winding deformation, winding displacement, faulty core grounding, faulty screen connections, damage during transportation.
Indication: High through fault currents, Buchholz relay warning or tripping, DGA, impact recorder results (transportation).
Test Method: Frequency Response Analysis (FRA) is a method to evaluate the mechanical and geometrical integrity of the core and windings within a power transformer by measuring the electrical transfer functions over a wide frequency range. The FRA is a comparative method, that evaluates the transformer condition by comparing the obtained set of FRA results to reference results on the same, or a similar, unit.
Method 1 – Sweep Frequency Response Analysis SFRA: A sinusoidal AC voltage with variable frequency (several Hz to several MHz) is connected to each phase of the HV and the LV windings with all other windings open-circuited.
Method 2 – Impulse Frequency Response Analysis IFRA: An impulse is injected into each phase of the HV and the LV windings with all other windings open-circuited. The input and output impulse curves = f(t) of the windings are recorded. The time-domain results are transformed into the frequency domain by using FFT algorithms. The input voltage (Uin) and the output voltage (Uout) are calculated for different frequencies.
It is observed that both methods give satisfactory results but Method 2 does not give results in the low-frequency range (below 1kHz).
Reference: Three methods are commonly used to assess the measurements (traces):
- Time-based (current FRA results will be compared to previous results of the same unit)
- Type-based (FRA of one transformer will be compared to an equivalent type)
- Phase comparison (FRA results of one phase will be compared to the results of the other phases of the same transformer)
Interpretation: No limits are defined. Comparison with benchmark data will indicate changes.
Comments and Suggestions: For transportation assessment the FRA should be the last test before departure and the first test upon arrival. No winding resistance DC measurement should be made before an FRA measurement is carried out. The residual flux could impact the measurement.
Benchmark raw data should be stored to facilitate later comparisons.
Suggested Video – Frequency Response Analysis with OMICRON FRAnalyzer
Go back to the Contents Table ↑
2.2 Polarization/Depolarization Current (PDC) Method Detectable failures
Detectable Failures: Water content in the solid cellulose insulation of oil-paper insulation, insulation failures, ageing of insulation, contamination of insulation liquids with particles, acids, water in solid and liquid insulation, partial breakdowns of capacitive bushing layers.
Indication: High moisture in the oil, general assessment of insulation condition.
Test Method: The principle of this measurement is to apply a DC voltage across the insulation during a certain time and to measure the polarisation current. Then the insulation is short-circuited at a variable time and the current is measured again (depolarisation current).
A time-domain current measurement records the charging and discharging currents of the insulation. The derived measurement method is called the Polarization Depolarization Current method.
Figure 3 – Polarisation and Depolarisation Current
Reference: Moisture determination by modelling, comparison to fingerprint measurements
Interpretation: Moisture determination is based on a comparison of the transformer’s dielectric response to a modelled dielectric response. An algorithm rearranges the modelled dielectric response and delivers moisture content and oil conductivity.
Comments and Suggestions: New procedures consider also the dielectric properties of aged pressboard in order to compensate for the influence of ageing.
Suggested Video – Polarization index testing theory
Go back to the Contents Table ↑
2.3 Frequency Domain Spectroscopy (FDS)
Detectable Failures: Water content in the solid cellulose insulation of oil-paper insulation, insulation failures, contamination of insulation liquids with particles, acids.
Indication: High moisture in the oil, general assessment of insulation condition.
Test Method: The principle of this measurement is the same as Capacitance and Dissipation / Power Factor described previously but differs by being applied at different frequencies, typically from 0.001 Hz to 1000 Hz as shown in the following traces:
Figure 4 – Frequency Domain Spectroscopy

Reference: Moisture determination by modelling, comparison to fingerprint measurements, limits for dry, moderately wet and extremely wet insulation are given in IEC 60422.
Interpretation: Moisture determination is based on a comparison of the transformer’s dielectric response to a modelled dielectric response. An algorithm rearranges the modelled dielectric response and delivers moisture content and oil conductivity.
Comments and Suggestions: The combination of time-domain polarization current measurements with frequency-domain spectroscopy reduces the test duration compared to existing techniques.
Essentially, time-domain measurements can be accomplished in a short time but are limited to low frequencies (typically below 1 Hz). In contrast, frequency-domain measurements are feasible for high frequencies as well but take a very long time at low frequencies.
In its application to high voltage bushings, the measurement of Dissipation / Power Factor at low frequencies (some Hz) enables the detection of moisture with high sensitivity. Figure 16 below demonstrates the typical moisture sensitivity of the Dissipation / Power Factor Measurement on OIP bushings between 20 Hz and 400 Hz.
Figure 5 – Dissipation / Power Factor Measurement on OIP Bushings at Different Frequencies
As a guide, indicative limits for Dissipation / Power Factor in new and aged bushings at frequencies of 15 Hz, 50/60 Hz and 400 Hz are given in the following table.
Table 2 – Indicative DF/PF Limit Values for Condenser Bushings
| RIP Resin impregnated | OIP Oil impregnated | RBP Resin bonded paper | ||||
| Frequency* | new | aged | new | aged | new | aged |
| 15 Hz | <0.6% | <0.7% | <0.5% | <0.7% | <0.7% | <1.5% |
| 50/60 Hz | <0.5% | <0.5% | <0.4% | <0.5% | <0.6% | <1% |
| 400 Hz | <0.6% | <0.7% | <0.5% | <0.7% | <0.7% | <1.5% |
| * at 20°C | ||||||
Go back to the Contents Table ↑
2.4 Electrical Method for Partial Discharge (PD) Measurement
Detectable Failures: Partial discharges, singular insulation faults.
Indication: DGA
Test Method: For detection, different types of coupling are used, for example, bushing capacitance taps, high-frequency current transformers or coupling capacitors.
However, modern multi-channel PD measuring systems which can record the PD on all channels simultaneously, and new methods such as the Three-Phase Amplitude Relation Diagram (3PARD) or the Three-Centre Frequency Relation Diagram (3CFRD), can be used to separate PD sources from each other and from external electromagnetic noise (interference).
Reference: Fingerprint measurements, trend analysis.
Interpretation: For PD On-site measurement, limits cannot be defined; This technique can be used with Acoustic PD in order to facilitate PD localization.
Comments and Suggestions: PD measurement is important to detect and locate a weakness in the insulation system. Partial discharge activity typically occurs within insulation voids, on ungrounded metal objects lying in an electric field, or as corona due to the intense electric stress on the insulation surrounding sharp-edged/shaped electrodes.
A significant increase of the PD level or the rate of the PD can provide an early indication for evolving defects. The PD pulses generate electromagnetic waves, acoustic signals, chemical reactions, local heating and optical signals.
Different techniques can be used to detect these phenomena.
Suggested Video – Partial Discharging (PD) testing an iron-core tuning reactor at NEPSI
Go back to the Contents Table ↑
2.5 Acoustic Partial Discharge (PD) Measurement
Detectable Failures: Partial discharges.
Indication: DGA
Test Method: The acoustic partial discharge measurement uses the fact that an acoustic signal is emitted by PD activity as a result of pressure fluctuations. Because of the short duration of the PD impulses, the resulting compression waves have frequencies that range up to ultrasonic. The frequency spectrum lies in the range between several Hz and several 100 kHz.
In transformers, mechanical waves generated by PD propagate through the oil, hitting the tank walls where Piezoelectric sensors for acoustic signal detection are fixed externally. By using trigonometry techniques, the source of the acoustic emission can be localized, greatly assisting any corrective maintenance.
Reference: Fingerprint measurements, trend analysis
Interpretation: For Acoustic PD measurements, there are no limits applicable.
Suggested Video – Power Transformer Partial discharge testing & global monitoring solutions
Go back to the Contents Table ↑
2.6 Partial Discharge (PD) Measurement using UHF Technology
Detectable Failures: Partial discharges, Singular insulation faults.
Indication: DGA
Test Method: Decoupling of the UHF PD signals from within the tank of a power transformer requires the sensitive UHF sensors to penetrate through the tank wall. Alternatively, a UHF antenna installed inside the tank is used. UHF signals have much less damping than acoustic signals.
The important localization of the PD is achieved by using the acoustic signal travel times. Wave shape and time of flight methods may be used for the localisation of PD sources.
Reference: Fingerprint measurements, trend analysis.
Interpretation: For UHF PD measurements, there are no limits applicable.
Suggested Video – Demonstration of UHF partial discharge location in a power transformer using time-of-flight techniques.
Go back to the Contents Table ↑
2.7 Frequency Response of the Stray Losses (FRSL)
Detectable Failures: Local overheating due to excessive eddy current losses linked by the stray flux. Short circuits between parallel strands of Continuously Transposed Conductors (CTC).
Indication: If parallel strands of CTC have short circuits between them, the losses in the stray channel are increased. This results in high internal temperatures, normally indicated by the DGA.
Test Method: An AC source with variable frequency (typically some Hz up to some hundred Hz) is connected to each phase of the HV winding with the corresponding LV winding short-circuited. The source current and the voltage across the HV winding are measured. The stray losses are represented by the AC resistance of the short circuit impedance at higher frequencies. The resistive part of the complex impedance has to be measured.
This can be done by using a complex impedance measuring device. Instead of the complex impedance measuring device, a wattmeter can be used to determine the real part of the complex impedance.
Reference: Comparison of the three phases, fingerprint measurements (one phase test)
Interpretation: ∆L: Less than 2.5% between phases; ∆R: Less than 15% between phases.
Comments and Suggestions: The test can be done also from the LV side. For comparison of the results the values have to be corrected by the square of the winding ratio.
Suggested Video – Three-phase test system for comprehensive power transformer testing
Go back to the Contents Table ↑
2.8 Recovery Voltage Method (RVM)
Detectable Failures: Trend indication of internal moisture or ageing in oil-paper insulation.
Indication: High moisture in the oil.
Test Method: DC voltage measurements are used to record a recovery voltage that develops across composite oil-solid insulation due to the phenomenon of space charge relaxation. Initially, the insulation is charged with a DC voltage over a certain time. Next, a short circuit is applied for a much shorter time (typically half the charging time). The short circuit is then removed and the recovery voltage is measured, with its maximum value used for the assessment.
This is one of a series of recovery voltage measurements taken with steadily increasing charging times. The accumulated series of voltage maxima yields a “Polarization Spectrum” used to evaluate the moisture content in cellulose. This derived diagnostic is the Recovery Voltage Method (RVM).
Reference: Fingerprint measurements, trend analysis
Interpretation: The RVM (Return Voltage Measurement) in its present form can only be used for trend indication.
Suggested Video – Dielectric Response Analysis – Basics
Go back to the Contents Table ↑
3. Summary Table
Table 3 – Summary of the typical problems that may be detected with electrical tests and dissolved gas analyses (DGA)
| Test Type | Diagnostic Technique | Type of problem | |||||
| Winding Turn to Turn Insulation | Winding, Bushing Insulation | Winding, Bushing, OLTC Continuity | Winding Geometry | Magnetic Circuit Insulation | Magnetic Circuit Integrity | ||
| Basic Tests | Winding Ratio | ✓ | |||||
| Winding Resistance | ✓ | ||||||
| Magnetisation current | ✓ | ✓ | |||||
| Capacitance and DF/PF | ✓ | ✓ | ✓ | ✓ | |||
| Leakage Reactance | ✓ | ||||||
| Insulation Resistance | ✓ | ✓ | |||||
| Core Ground Test | ✓ | ||||||
| Special Tests | Frequency Response of Stray Losses | ✓ | ✓ | ||||
| Frequency Response Analysis | ✓ | ✓ | ✓ | ✓ | |||
| Polarisation/Depolarisation | ✓ | ||||||
| Frequency Domain Spectroscopy | ✓ | ||||||
| Recovery Voltage Method | ✓ | ||||||
| Electrical Detection of PD | ✓ | ✓ | |||||
| Acoustical Detection of PD | ✓ | ✓ | |||||
| UHF Detection of PD | ✓ | ✓ | |||||
| Dissolved Gas Analysis (DGA) | ✓ | ✓ | ✓ | ✓ | ✓ | ✓ | |
Go back to the Contents Table ↑
Reference: Guide for Transformer Maintenance: C. Rajotte ( CA) – (Convener), TF Leaders: M. Foata (CA), P. Jarman (UK), F. Larese (FR), P. Lorin (CH), B. Pahlavanpour (UK), J.P. Patelli (FR), J. Velek (CZ), R. Willoughby (AU), R. Barrento (PT), P. Boman (US), I. Diaconu (RO), A. Drobyshevski (RU), Y. Ebisawa (JP), T. Fagarasan (RO), N. Fantana (DE), H. Gago (ES), J. Gebauer (DE), P. Gervais (CA), M. Krüger (AT), G. Lawler (IR), R. Maina (IT), C. Moldoveanu (RO), P. Mueller (CH), D. Olan (CA), L Paulhiac (FR), M. Pena (BR), E. Perez-Moreno (ES), S. Quintin (ES),V. Samoilis (GR), F. Simon (FR), A. Shkolnik (IS), B. Sparling (CA), and P. Warczynski (PL).
Related electrical guides & articles


Edvard Csanyi
Hi, I'm an electrical engineer, programmer and founder of EEP - Electrical Engineering Portal. I worked twelve years at Schneider Electric in the position of technical support for low- and medium-voltage projects and the design of busbar trunking systems.I'm highly specialized in the design of LV/MV switchgear and low-voltage, high-power busbar trunking (<6300A) in substations, commercial buildings and industry facilities. I'm also a professional in AutoCAD programming.
Profile: Edvard Csanyi

Very much interested. Need further clarification or discussion.
B Ahmed
Electrical Engineer
It’s a superb article. Complete and very useful. All practical aspects covered in detail.
Wonderful presentation! I find it complete and accurate. I look forward to viewing more articles like this one in the future.
Thank you, David.