
Voltage instability and collapse
The problem of voltage stability and voltage collapse has been studied and investigated for some decades now. A number of incidents have appeared around the world and some intensive work has been made to better understand the phenomena and to improve power system operation with respect to voltage stability. Several reports have been published within the very wide area of voltage stability.
 Inside the power grid collapse and measures for preventing voltage instability and loss
The P-V curve (or Q-V curve) describing a transmission system receiving end voltage as a function of the receiving end active (or reactive) power has become a symbol for voltage stability. This way of describing the voltage stability (or voltage collapse) phenomena is a static approach related to the transmission system limitation with respect to the load demand.
Therefore voltage stability is also called load stability (compared to angular stability, which often is called generator stability). Voltage stability is also very closely related to the availability of reactive power.
Other aspects of voltage stability are related to the generator capabilities and limitations.
During the last thirty years, deterioration of the voltage profile has been the cause of a number of generalized power system incidents, in a variety of ways. The result of these varied incidents was increased care for power system protection against voltage collapse, and involvement in studies for a better understanding of voltage stability phenomena, which may be quite complex.
- Voltage stability phenomena
- The role of various power subsystems
- Loads
- Consumers
- Voltage variations
- Transmission lines and cables
- Vars and “dynamic” vars
- Generators
- Capacitors and reactors
- Static var compensators
- On-load tap-changers (OLTCs)
- Secondary voltage control (and tertiary voltage control)
- Gas turbines
- Load shedding
- Communication links
- Operators
- Multiple time domains
- Multi-loop system
1. Voltage stability phenomena
Although the processes involved in voltage stability phenomena may be very complex and raise both static and dynamic aspects, a few simple examples are useful to consider and to keep in mind.
Let us take only two considerations: voltage drops and maximum transmission capacity.
1.1 Voltage drops
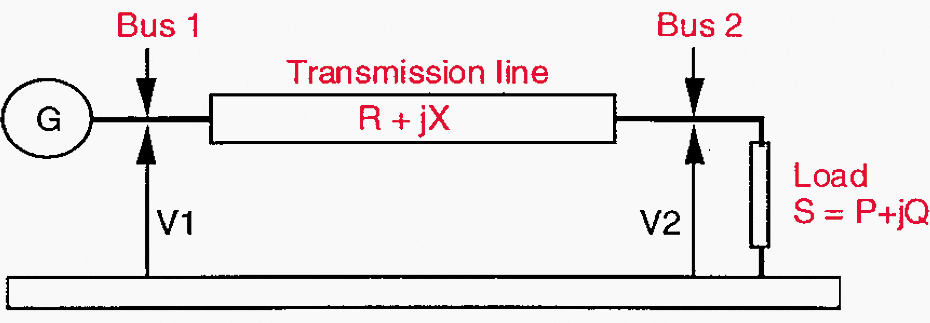
Let us consider the trivial electrical model according to Figure 1, where a synchronous generator G feeds a load through a transmission line represented by a single series impedance ZL= R + jX, with the load power being S = P + jQ.
Considering that when the voltage profile is fair, the voltage is not too different at the two ends of the line, and that the power transmission angle ψ is small (ψ = difference of voltage angles at the two ends of the line), we find the well known voltage drop along the transmission line:
ΔV = [(RP + XQ) + j(XP – RQ)] / V2
Which may be shared into two components:
- a voltage drop in phase with V2, equal to: (RP + XQ) / V2
- a voltage drop in quadrature with V2, equal to: (XP – RQ) / V2
Figure 1 – Basic transmission system model
Seen from any system operator or from (almost) any protection device, the estimation of the voltage is based on the measurement of the voltage magnitude, so the component in phase has to be considered at first approximation.
And from the very simple equations above, we may find interesting clues for both planning, operational, protection, static and dynamic aspects, because we want low voltage drops:
Clue #1 – We must look for high voltage profile, well sized transmission network between generators and loads, low reactive power consumption at load level.
Clue #2 – Dynamic aspects are very important to take into account, because all the parameters of the formula are liable to vary in real time: consistency of the transmission link between generators and loads (owing to topology changes or to line trips), consumption of the load (variations of the load demand, sensitivity of load to voltage…), voltage profile.
Clue #3 – and we must also remember that the values of the voltages ate not a perfect modelling of the reality.
Let us remember that 1% error at measurement level represents 4 kV for a 400 kV voltage, which is quite high when we have to control voltage in a narrow range, let us say between 380 and 420 kV in normal conditions.
Go back to the Contents Table ↑
1.2 Maximum transmission capacity
Let us take again our trivial electrical model of Figure 1. This time, we will assume that the voltage level is maintained constant at the generator end (transmitting end: Bus 1). Moreover, we will simplify the problem by stating that the transmission line resistance may be neglected in comparison with the reactance, and that the reactive power of the load is zero.
Then we will consider alternative variants: in the first one, the variation of voltage at load level (receiving end: bus 2) is free; in the second one, the voltage at load level is also maintained constant.
A major difference is also that it is impossible to maintain the voltage constant at load level if the reactive power of this load is zero, which shows that keeping the voltage constant at load level implies to control the reactive power of the load (by means of compensation of reactive power).
From the interesting equations which may be written when the load voltage is constant, we will keep the following ones:
| P= [|V1|×|V2|×sinψ] / X | Real power transmitted to the load, in MW/phase |
| Q2= [|V1|×|V2|×cosψ − |V2|2] / X | Reactive power at receiving end, in Mvar/phase |
| Q1= [|V1|2 − |V1|×|V2|×cosψ] / X | Reactive power at emitting end, in Mvar/phase |
where |V| is the magnitude of phasor V.
When the voltage level is left uncontrolled at load level, we also know from technical literature that we can plot the well known “P-V curve” describing the relationship between the real power which may be delivered to the load and the voltage of the load, see Figure 2.
This curve may also be considered as plotted as a function of the value of the load resistance, with point A being infinite resistance and point B being zero resistance; if the emitting voltage remains constant and if the value of the load resistance varies from infinite value to zero, the operating point M will follow the curve from A to B.
At the “critical point” C, we have the maximum of real power transmitted to the load.
Figure 2 – The P-V curve for a transmission system
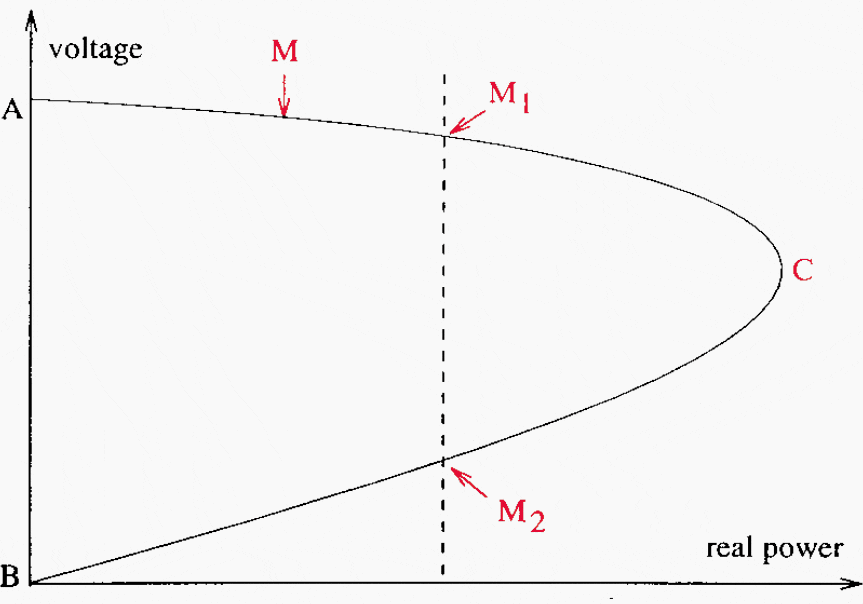
For a given value of real power supplied to the load, there seems to be two possible operating points M1 and M2. In fact the part of the P-V curve which is below the critical point C does not correspond to satisfactory operation. At point M2, for the same real power flow, the voltage of the load is much lower, the load current and the losses are much higher.
If the consumers are supplied through transformers with On-Load Tap-Changers (OLTCs), the behaviour of these OLTCs will not be small-disturbance stable.
For instance the OLTCs will try to raise the voltage at the terminals of the load by changing the tap of the transformer. It will have the effect to reduce the apparent impedance of the load seen from the system, and thus to lower again the voltage; then the OLTCs will continue to change taps, and the process will continue into a voltage collapse until the OLTCs reach their ultimate taps.
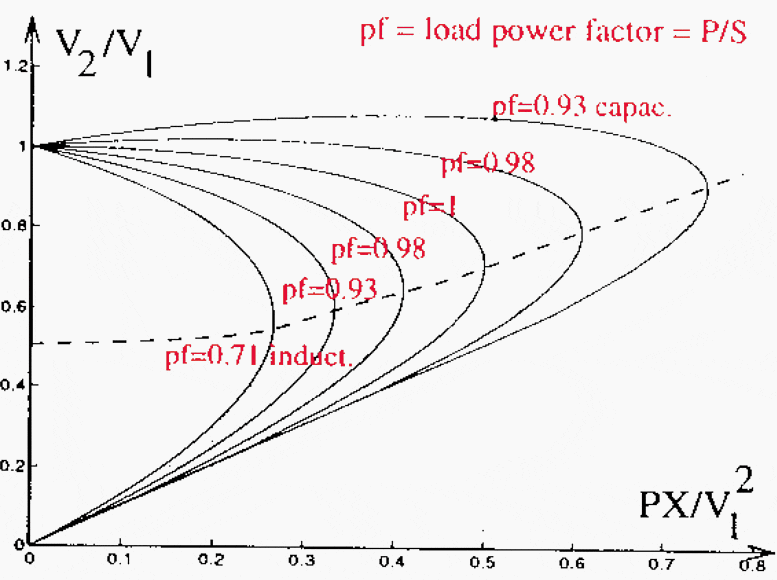
In Figure 3, we can see how the P-V curve changes with the value of the emitting voltage V1. Figure 4 shows how the P-V curve varies when the nature of the load changes (capacitive and inductive loads), at constant value of emitting voltage.
Figure 3 – Change of P-V curve due to emitting voltage

Figure 4 – Change of P-V curve due to load power factor
Here again, from these very simple situations, interesting observations may be deduced:
Observation #1 – In a given network structure, there is a maximum transmission capacity which cannot be exceeded when we want to supply a load with real power. In certain conditions, the operating point may become unstable.
Observation #2 – A high voltage profile enables an increase of the maximum transmission capacity.
Observation #3 – A well sized transmission network between generators and loads, leading to a low value of X, has the same effect.
Observation #4 – The characteristic of the load has a strong effect. Improvement of the load power factor through compensation enables the system to reach higher transmission capacities.
Observation #5 – Dynamic aspects are very important to take into account, for the same reasons as those explained when we considered voltage drops.
Observation #6 – From the equations, it is obvious that voltage and reactive power are closely linked.
Observation #7 – The reactive power may be quite different at the two ends of a transmission line, which we will translate as: “reactive power is difficult to transmit at distant points”.
Observation #8 – From the comparison of the situations where the load level is uncontrolled or controlled, we can deduce that it is very important for a power system to have a fair number of buses where the voltage can be kept constant.
So the question is how to get buses with constant voltage; here the generators are most important, provided that:
- They have a good primary Automatic Voltage Regulator (AVR) and
- They arc sized with a nominal power factor giving sufficient reactive power capacities: when the generator reaches its maximum reactive reserves, the voltage is no longer maintained constant at the generator bus.
Observation #9 – It is necessary to keep the operating point sufficiently distant from the nose of the P-V curve, as the lower part of this curve is not stable.
It needs to be careful about possible evolution of the load (increasing the load shifts the operating point to the right), possible evolution of network topology (if there is a topology change, there is a change of P-V curve), and other possible non-linearities.
Go back to the Contents Table ↑
1.3 A simple example of voltage collapse
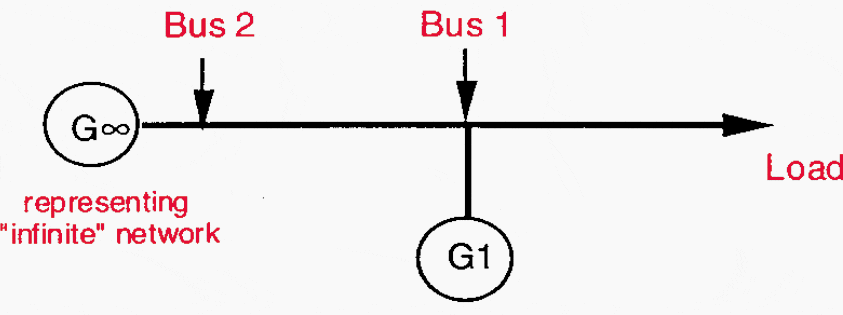
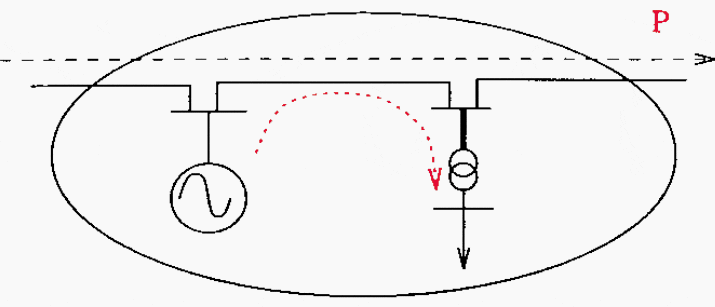
Let us now study a simple example, representative of many of the actual voltage collapses. We will assume that a load is supplied, through a transmission line, by a generator G1 equipped with a good AVR which is successful in maintaining the voltage constant at Bus 1 as far as the reactive reserves of generator G1 are not exhausted, see Figure 5.
Bus 1 is connected, through different means equivalent to another transmission line, to Bus 2 representing the bulk network (“infinite” network) which may be considered as a generator G∞ with infinite capacities able to maintain the frequency and the voltage constant in every situation.
Figure 5 – A simple system for voltage collapse studies
Let us suppose now that we are in the early morning and that the load begins to increase, with the starting of domestic and industrial activities.
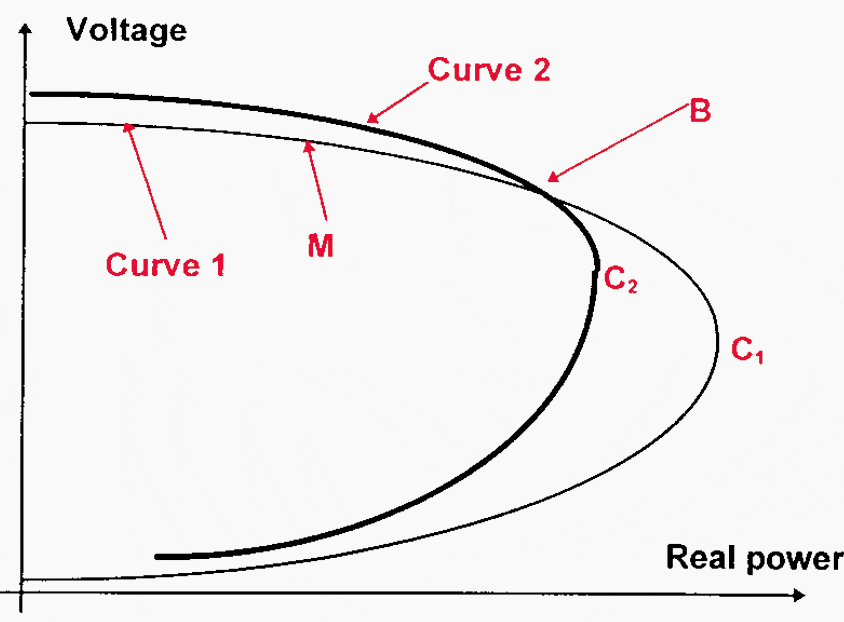
The situation is fairly good for the power system, as we have two buses (1 and 2) where the voltage is maintained constant, and the operating point M, in Figure 6, drifts slowly towards the right on Curve 1 representing the situation with constant voltages at Buses 1 and 2; there is a fair distance to the maximum transmission capacity (critical point C1).
As the load continues to increase, generator G1 has to produce more reactive power; finally, G1 reaches the limits of its reactive reserves (operating point B), and so the voltage cannot any more be maintained constant at Bus 1.
Now the operation point follows Curve 2 representing the situation where the voltage is constant only at Bus 2. This is a strong non-linearity; whereas the distance to maximum transmission capacity was from point B to point C1, it is now only from point B to point C2. If the load continues to increase, and if no action is taken very fast, it may come into a voltage collapse.
Now it may be seen that protection against voltage collapse involves careful studies from planning stage to real time.
Figure 6 – P-V curves for different modes of operation according to Figure 5
1.3.1 The incident
Several years before the incident, planning studies have led to decide where it would be necessary to build transmission lines and generators to supply the load, and what should be the suitable characteristics of these generators and lines, according to load forecasts. These studies must be performed early enough to build the generators and lines.
Other studies are required to decide where new sources of reactive power (capacitors, etc.) should be located and where OLTCs must be provided, and which new protection schemes are necessary for prevention of voltage collapse. Training is provided to the operators of the power plants and control centres so that they will react correctly if they should have to face a voltage incident.
Let us come to a few months before the incident.
Now the generators, lines, compensation means, protection schemes and devices are available and it is too late to build new ones. The operators have to cope with the existing facilities. From this moment to the day of the incident, they must take other decisions which should consider possibilities of voltage collapse.
The day before the incident, other studies (using load forecasts and optimisation programs) will guide the decision as to where the production must be supplied and what is the best system topology.
Finally comes the day of the incident.
When the incident occurs, everything lies upon the actions of the protection devices and of the operators. A precise prediction of the evolution is very difficult as many non-linearities are liable to occur. If the operators have no help from voltage collapse indices, it may be quite difficult for them to detect the risk and to decide what to do.
Every action needs time to be realized, and time is precious in case of voltage incident: inserting a new capacitor bank doesn’t have the same effect when performed early or late, because the efficiency of the capacitor is a function of the square of the voltage, and the voltage is dropping. Even load shedding will be ineffective if performed too late.
Previous staff training is also very important: it can still be seen during voltage collapses that operators of the power plants trip their units so as to protect them, when keeping the generation would enable survival of the power system.
Go back to the Contents Table ↑
1.4 Another emerging voltage collapse scenario
With the clear trend in deregulating the power industry, some utilities nested in large interconnected systems, are likely to be subject to increased transfers of power flowing through their network. These power flows may have huge impact on voltage stability and security.
The situation is sketched in Figure 7.
The system may originally be prone to voltage problems because of the electrical distance between its generation and load centers (dotted line). The voltage and reactive power support from the neighbouring systems is assumed to be marginal. The increased loading of the transmission facilities by the external power transfer (dashed line) may significantly reduce the security margins with respect to internal line or generator outages.
Figure 7 – Voltage instability caused by increased power transfer through certain areas
Go back to the Contents Table ↑
2. The role of various power subsystems
During a voltage collapse, dynamic effects come from many mechanisms.
Go back to the Contents Table ↑
2.1 Loads
Loads are generally voltage dependent, according to the nature of the load. Resistive loads are considered as leading to less severe conditions, because the actual load decreases as the square of voltage when voltage decreases. However, heating appliances can lead, due to action of thermostats, to power recovery in the time-scale of minutes after a voltage reduction.
Swedish studies have shown that this is due not only to thermal inertia but also to the behaviour of the thermostatic controller with respect to voltage.
Induction motor loads are quite severe as the reactive power absorbed by a motor can increase during a voltage reduction.
OLTCs, which aim at ensuring the quality of supply by sustaining the voltage at consumer level, may have a detrimental effect when seen from the power system side.
Suggested Reading – Load flow and short circuit analysis of a MV substation (case study 33/11 kV substation in ETAP)
Load flow and short circuit analysis of a MV substation (case study 33/11 kV substation in ETAP)
Go back to the Contents Table ↑
2.2 Consumers
Consumers have a very strong effect on the demand of real power, and thus on the demand of reactive power. The evolution of the demand may be very sharp. The voltage collapse in Japan (1987) was explained by a massive and unexpected use of air-conditioners. Good load forecasts enable the provision of good generator schedules and good reactive reserves.
Past experiences have shown that manual load shedding may put some moral pressure on the power system operators, because operators know that consumers will claim in case of load-shedding. Thus, it may cause the operators to hesitate to order load sheddings even when such actions would be necessary.
Go back to the Contents Table ↑
2.3 Voltage variations
A power system may be affected by many variations, which are quite varied in terms of time dynamics and magnitude. The variation of load demand generally leads to slow dynamics, whereas a generator tripping produces an instantaneous drop, which may be quite large if the power system lacks buses with constant voltage.
As a power system has many means to provide reactive reserves and to sustain voltage, a coordinated use of these means is suitable. Slow means should be used to deal with slow variations, so that the fast means will be available when fast action will be required.
Go back to the Contents Table ↑
2.4 Transmission lines and cables
Please refer to Section 1 above, because it’s dedicated to transmission lines and cables.
2.5 Vars and “dynamic” vars
Services supplied by generators and by static means (capacitors, reactors) should not be considered as equivalent. A generator can provide instantaneous and accurate action, and constitutes a bus with constant voltage (when reactive resources are available) which is precious for power system security.
On the contrary, the efficiency of capacitors is a function of the voltage and is affected by the delays associated with automatic control equipment. Thus a special label of “dynamic vars” should be attributed to generators as well as synchronous condensers and static var compensators (SVCs).
Suggested Course – Power System Modeling and Stability Analysis Using ETAP – Beginner to Advance Level Course
Power System Modeling and Stability Analysis Using ETAP – Beginner to Advance Level Course
Go back to the Contents Table ↑
2.6 Generators
The action of the modem primary automatic voltage regulators (AVRs) is instantaneous and quite efficient. Even if modern generators may provide temporary additional Mvars through overexcitation capacities, a good power factor is invaluable. Many generators are equipped with overexcitation limiters so as to protect equipment from overheating, and with underexcitation limiters for stability reasons. Protection devices are also implemented.
All these components deeply affect the behaviour of the generator in case of voltage reduction or voltage collapse.
In the case of a large voltage reduction, these motors are liable to stall. It is necessary to study the power plant design so that the critical functions will remain supplied, and to provide appropriate protections. Poor voltage conditions may lead to generator tripping, thus losing a’ bus with constant voltage.
Generator islanding is generally to be preferred to shutdown, because restoration of load will be faster.
Suggested Reading – Four abnormal operating conditions of a generator that could shut down the power plant
Four abnormal operating conditions of a generator that could shut down the power plant
Go back to the Contents Table ↑
2.7 Capacitors and reactors
Combined with the evolution of the load demand, shunt capacitors are precious to power system security if they are settled near consumer loads and controlled in a good way, because they reduce transfers of reactive power through the network. Moreover, shunt capacitors are relatively economical.
The type of control has a large effect on their efficiency. If controlled by standard clock devices, capacitors may come to be tripped in an inadvertent way (for example during public holidays, if the clock is not adjusted to these days).
Series capacitors may also be used for reducing impedance of long transmission lines.
Suggested Reading – Six MV/HV applications of series capacitors for improving the power quality
Six MV/HV applications of series capacitors for improving the power quality
Go back to the Contents Table ↑
2.8 Static var compensators
Though still expensive, SVCs are interesting due to their fast action. Static var compensator is a controllable source of reactive power, and supplies a bus with constant voltage in the active range of the SVC, i. e. as far as the automatic control part of the SVC does not reach the limits of the design.
SVCs cannot be considered to be as good “dynamic” var producers as generators, because they become a pure association of capacitors and/or reactors when their automatic control system reaches its limits.
An SVC must be designed for given power system situations, and it will not be efficient if the actual situation overpasses the planning criteria.
Suggested Reading – Controlling power system parameters through reactive power (VAr) compensation
Controlling power system parameters through reactive power (VAr) compensation
Go back to the Contents Table ↑
2.9 On-load tap-changers (OLTCs)
OLTCs are important to sustain the voltage at customer level in normal conditions and to decouple the different levels of the power system (EHV, HV, MV), but they also may become detrimental, during a voltage collapse. In such conditions, they may have to be blocked on the current tap, or even moved to a predetermined tap.
When the power system is equipped with different levels of OLTCs (EHV/HV, HV/MV), it is necessary to use delayed action, with different delays according to the level of the OLTCs, so that there will be no sustained interaction between the different levels of OLTCs. These delays lead to additional time factors in the dynamic process of voltage control.
During a voltage instability situation with low transmission system voltages the OLTCs normally raise their secondary side voltages, after some delay. The effect on the system of this action depends on the load-voltage characteristics. For constant power load with shunt capacitors it is beneficial to raise the voltage, and for impedance load it is not beneficial to raise the voltage.
Suggested Reading – Where and how to find the root cause of a power transformer failure (troubleshooting guide)
Where and how to find the root cause of a power transformer failure (troubleshooting guide)
Go back to the Contents Table ↑
2.10 Secondary voltage control (and tertiary voltage control)
The control of reactive power and voltage control may be classified in primary, secondary and tertiary levels of control, which are de-coupled in time and space.
Primary control consists in actions on individual equipment, based on local measurements, in a time scale from less than one second to about one minute. Secondary voltage control is the coordination of Q/V resources within an area, in a time scale of between one and a few minutes. Then tertiary control is a global optimization on a utility, pool or country level based on real time measurements, in a time scale of 10 minutes or more.
Secondary voltage control must be used wisely, and with adequate security margin. Secondary voltage control leads to optimized use of reactive reserves in a whole region, therefore new reserves must be found when too much of the existing ones are used.
If new reserves are not available, the reserves will be mobilized all over the region and as reactive power cannot be transmitted efficiently from distant buses, there will be no more help available.
Suggested Reading – Design guide for upgrading existing secondary substations to be smart and intelligent
Design guide for upgrading existing secondary substations to be smart and intelligent
Go back to the Contents Table ↑
2.11 Gas turbines
When the power system lacks MW and Mvar, the availability of fast starting gas turbines (or other generators able to produce additional MW and/or Mvars very fast) may be a key for avoiding the voltage collapse.
In addition to their MW and Mvars, they also produce additional buses with constant voltage, if they are equipped with AVRs.
Suggested Reading – 12 essential parameters required for rating large generators
12 essential parameters required for rating large generators
Go back to the Contents Table ↑
2.12 Load shedding
Even though consumers do not like it, load shedding may be the ultimate efficient action, and it may also save the larger troubles which could occur if load is not shed. If the voltage collapse is too fast, the time delays inherent in communication means and in operators analysis may cause manual load shedding to be ineffective.
To counteract a fast voltage collapse, automatic load shedding must be applied.
Further Study – The art of load shedding and online applications in a power system under an emergency state
The art of load shedding and online applications in a power system under an emergency state
Go back to the Contents Table ↑
2.13 Communication links
As many actions (operators, regulators, protections) need use of communication links, the communication performances (reliability, accuracy, time delays, etc.) are of vital importance.
Go back to the Contents Table ↑
2.14 Operators
Even for well trained operators, a voltage collapse is a difficult challenge because it is very difficult to analyze the possible evolution and to determine the adequate actions to be ordered. Work is still progressing to provide the operators with the suitable risk estimations and with the means for preventive and curative actions.
A good global comprehension of system, generation and distribution aspects is also invaluable for a good co-ordination of the operators at different levels (control centres, power plants, substations, distribution).
Suggested Reading – Practical troubleshooting of power interruption in fully operational 33/11 kV substation
Practical troubleshooting of power interruption in fully operational 33/11 kV substation
Go back to the Contents Table ↑
2.15 Multiple time domains
It may be seen from above that voltage collapses involve many time spans, from the faster phenomena associated to initial incidents (short-circuits, etc.) and reactions of the fast automatic regulators and protections, to the slower ones coming from operators action and load behaviour.
Go back to the Contents Table ↑
2.16 Multi-loop system
Taking into account all the previous items, one can easily see that a good evaluation of voltage collapse needs to consider the power system as a multi-loop automatic system.
Thus good simulation tools, which enable to take into account both slow and fast dynamics, are invaluable for designing good protective actions.
Go back to the Contents Table ↑
Source: Protection against voltage collapse by CIGRE participating members of WG 34.08 : T. VAN CUTSEM (Belgium), J.L. FERNANDEZ (Spain), C.F. HENVILLE (Canada), D. KARLSSON, Convenor (Sweden), R. KREBS (Germany), M. E. MANDOZZI (Italy), A. VAN RANST (Belgium), and J-M. TESSERON (France)
Related electrical guides & articles


Edvard Csanyi
Hi, I'm an electrical engineer, programmer and founder of EEP - Electrical Engineering Portal. I worked twelve years at Schneider Electric in the position of technical support for low- and medium-voltage projects and the design of busbar trunking systems.I'm highly specialized in the design of LV/MV switchgear and low-voltage, high-power busbar trunking (<6300A) in substations, commercial buildings and industry facilities. I'm also a professional in AutoCAD programming.
Profile: Edvard Csanyi

Great article! I was just writing about Power Factor/ Beer analogies and Vars – your simple and thorough article cut through a lot of noise! Thanks
The article is timely and helpful to our profession