
Estimated Study Time: 17 minutes
How does it affect people?
Short-term exposures to electric fields produced by AC transmission lines and stations can be pretty serious and may be classified according to the type of effect causing a sensation in people. Information in this article is taken from the study that was performed by EPRI on EHV and UHV transmission lines.
 People response to short-term exposure to electric fields of AC transmission lines
Let’s discuss about three most common effects: spark discharges, electric fields and steady-state ac currents.
- Spark discharges, which introduce transient currents into a person when the electrical breakdown of an air gap occurs between the person’s body and a conductive object, or ground.
- Electric fields on the surface of the body, which exert forces on hair with consequent hair stimulation
- Steady-state AC currents, which enter a person contacting an object.
The preceding effects have been listed in order of practical frequency of occurrence above perception levels.
Contents:
- Human Response to Shocks
- Response to Spark Discharges
- Response to Steady-State Currents
- Response to Hair Stimulation
1. Human response to shocks
Spark discharges, causing a startle reaction or aversion to AC field exposure, are of major importance in establishing thresholds of annoyance or uncomfortable sensations. The effects of electric field on hair are of minor importance.
Responses to steady-state currents are used to establish safety limits with respect to the largest possible charged objects that a person might contact under conditions of good insulation of the object and good grounding of the person.
According to this criterion, four types of exposure may be identified:
- Primary shock
- Secondary shock
- Perception
- Below perception
Primary shocks may produce direct physiological harm. Secondary shocks cannot produce such harm but are annoying and may cause involuntary muscle reactions.
Secondary shock is of subjective interpretation, and it is difficult to define.
The IEEE PES Working Group on Field Effects (34) defines three different levels of secondary shocks:
- Annoyance (the person would consider the sensation to be mildly irritant if it occurs repeatedly),
- Startle (if it occurs unexpectedly, the sensation is likely to produce an unintentional muscular reflex that may be hazardous under a defined set of circumstances), and
- Aversion (the person exposed is motivated to avoid situations that he/she believes would lead to a similar experience).
Perception occurs when a person consciously detects whether or not a stimulus is present. The sensation is gentle and not necessarily unpleasant.
The preceding three categories of human response have mini-mum levels identified as:
- Minimum primary shock level
- Minimum secondary shock level
- Threshold of perception
Each of these levels is definable only in conjunction with a probability of occurrence in a well defined set of circumstances. This probability is expressed as a percentage of people who have reactions above a particular level.
2. Response to Spark Discharges
Different practical situations that may cause discharges were investigated at Project UHV using the UHV test line to generate the induction field. A total of 136 persons, 128 men and 8 women, volunteered for these measurements, which were conducted under different weather conditions.
A number of measurement stations were prepared under the UHV test line, and people were asked to answer questionnaires about their responses to different electric field effects.
Figure 1 shows the percentage of people who experienced sensations above the threshold of perception and above the mini-mum annoyance level.

The curves marked with a 4 in Figure 1 correspond to spark discharges between the thumb and the metallic shaft of an umbrella held at shoulder height. The participants were asked to hold the umbrella at the insulating handle, to move the thumb slowly until it touched the metallic shaft, and then to remove it.
UHV concurrently with the study of spark discharge sensations.
The results, presented in Figure 2 below, show the percentage of people who experienced sensations above the threshold of perception and above the minimum annoyance level.
The curves marked with a 1 correspond to stimulation of the hair of the hand, with the subject’s arm extended over the head searching for the position where the sensation is strongest. Curve 2 corresponds to stimulation of the hair of the head (forehead, eyebrows, sideburns), with the subject’s arms at the side of the body.
Curve 3 corresponds to a tingling sensation in parts of the body covered with clothes (elbow, shoulder, sides).
The median values of thresholds of perception are presented in Table 1.
Table 1 – Median values of electric field, threshold of perception
| Hand hair | 7 kV/m |
| Head hair | 23 kV/m |
| Between body and clothes | 20 kV/m |
Median annoyance levels are much higher and are never obtained in practical conditions. The basic mechanism of hair stimulation is not fully under-stood. It is assumed that hair collects charges that give origin to a force acting on the hair, thus causing its vibrations. Hair vibrations have been observed at both 60 Hz and 120 Hz.
Thus, the mechanical force on the hair has a frequency double that of the power frequency.
However, if the hair is insulating, a net charge of fixed polarity could remain on the hair, thus justifying a force at power frequency. The data obtained are reasonably matched by straight lines when plotted (1) with the field on a log scale and (2) with the probabilities of perception and annoyance on a normal probability scale.
The dispersion is much larger than for spark discharges, with a ratio of 7 to 9 between fields corresponding to 84% and 16% probability.
Also, for these sensations, the curves for annoyance are parallel to those for perception. The ratio between annoyance and perception fields is 6 to 10. For fields corresponding to 50% probability of perception, the probability of annoyance is 1 to 9%.
Low humidity and low temperature caused lower sensitivity, although the influence of individual parameters is not clear. Moisture on hair, created by humid weather or perspiration, increases the sensitivity.
The frequency of the electric field has an effect on the sensation.
Results of Project UHV tests performed with different frequencies are shown in Figure 3.
The data indicate a greater sensitivity at lower frequencies. The difference between the effects of 50-Hz and 60-Hz fields is very small and insignificant when com-pared with the large dispersion of these data.
3. Response to Steady-State Currents
Of practical interest for transmission-line design applications, are the AC currents flowing through a person’s body from hand to hand or from hand to feet when touching a large object, which collects currents induced by the ac electric field.
Experimental results from Mr. Dalziel (professor of electrical engineering and computer sciences at UC Berkeley) are shown in Figure 4 for direct current and in Figure 5 for alternating current.
The data follow a normal distribution with large dispersion (ratio 1 to 4 between 1% and 99% values) with average values for men equal to 5.2 mA for direct current and 1.1 mA for 60-Hz alternating current.
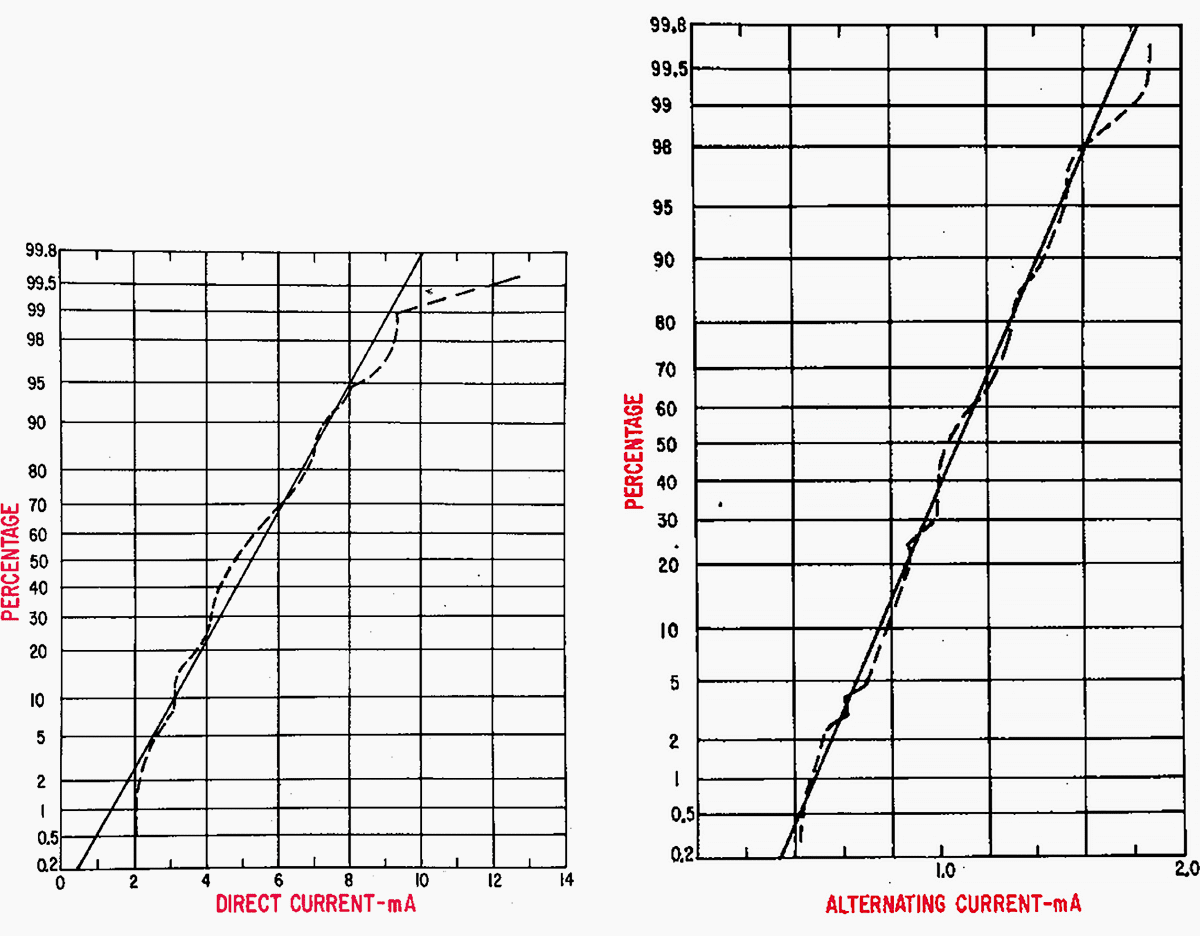
The first sensation for direct current is that of heat, whereas the first sensation for alternating current is a stinging sensation. Insufficient data are available for women.
As the steady-state intensity of the current increases, control of the muscles in which the current flows becomes increasingly difficult. Above a certain value of current, it is not possible to re-lease the grip on an object. The current for which this situation first occurs is called the let-go-current.
Figure 6 shows the distribution curve of let-go values for different currents.
Figure 7 shows the distribution curve for alternating current at 60 Hz. The minimum let-go values are arbitrarily chosen as those corresponding to a probability of 0.5%.
From Figure 7, such values are 9 mA for men and 6 mA for women. A more conservative figure of 5 mA might be applied to children.

The influence of frequency on let-go current is shown in Figure 8 below. Increasing the value of the current above let-go might pro-duce ventricular fibrillation.
Fibrillating current values are shown in Figure 9 as a function of body weight for different species of animals. The parameters influencing ventricular fibrillation are body weight, current magnitude, and shock duration.
Dalziel investigated the relation between current and time and proposed an electrocution equation:
i = k / √t
(i in mA, t in seconds).
For a probability of 0.5%, k=165.
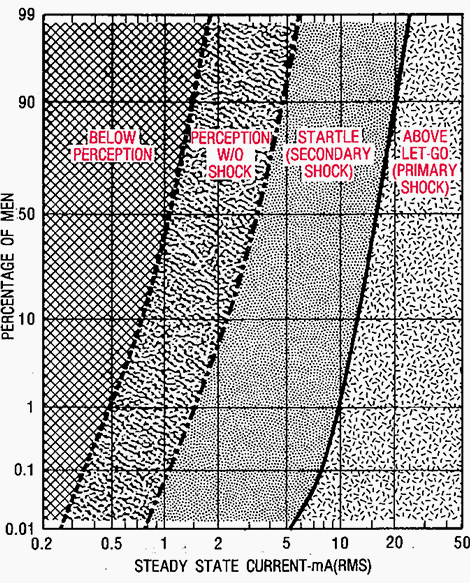
A summary of the response of adult men to steady-state ac electric currents is shown in Figure 10. The fewer data available for women indicate levels approximately two-thirds of those for men. Data for children are nonexistent.
Let-go values for children for a probability of 0.5% have been conservatively estimated as equal to 5 mA.
Different curves were obtained for rainy and fair-weather days. During rainy days, the umbrella’s material becomes wet and collects more charging current from the at field. Also during rainy days, finger sensitivity is higher because of higher humidity.
Curve 5 corresponds to spark discharges between a small grounded wire and the ankle. The participants were asked to re-main erect, to slowly touch the wire with the ankle, and then to remove the ankle.
Curve 6 corresponds to spark discharges between the tip of the index finger and a grounded rod with a slow approach and release. This last situation was considered as the base case for spark discharges. The discharged capacitance is that of a person to ground, which, for adult men, has an average value of 170 pF.
The median voltage-to-ground was 0.275 kV/(kV/m). From Figure 1 the following median values are obtained:
Median perception threshold:
- E = 2.7 kV/m
- Voc = 740V
- C = 170 pF
Median annoyance level:
- E = 7 kV/m
- Voc = 1900V
- C = 170 pF
The data obtained are reasonably matched by straight lines when plotted (1) with the field on a log scale and (2) with the probabilities of perception and annoyance on a normal probability scale.
The ratio between fields corresponding to 84% and 16% probability is between 2.5 and 4.3.
Results of Project UHV tests performed with different frequencies are shown in Figure 11. The data indicate that people are more sensitive to spark discharges in fields with higher frequency. The difference between the effects of 50-Hz and 60-Hz fields is very small and insignificant when compared with the large dispersion of these data.

4. Response to Hair Stimulation
Stimulation of hair nerves is believed to be the cause of sensations that are above the thresh-old of perception and above the minimum annoyance level.
These sensations were investigated at Project Code has specified that transmission-line clearances shall be consistent with a maximum induced current of 5 mA, to be calculated for the largest vehicle anticipated under the transmission line and for the final unloaded conductor sag at 49°C.
Abnormal phenomenon under a HV line (VIDEO)
Negative effects of electroMagnetic fields on humans (VIDEO)
Source: 345kV and above transmission line reference book by EPRI
Related electrical guides & articles


Edvard Csanyi
Hi, I'm an electrical engineer, programmer and founder of EEP - Electrical Engineering Portal. I worked twelve years at Schneider Electric in the position of technical support for low- and medium-voltage projects and the design of busbar trunking systems.I'm highly specialized in the design of LV/MV switchgear and low-voltage, high-power busbar trunking (<6300A) in substations, commercial buildings and industry facilities. I'm also a professional in AutoCAD programming.
Profile: Edvard Csanyi

Thank you Sir Edvard for sharing such wonderful electrical scientific article about affects of expousure under UHV transmission lines, i have understood very in detail about it. It is very wel determined and measured the human sensitivity from the volunteers to come to such conclusion that the short term affect are noted and such that such long term affect are also to be determined for under various circumtances and condition.
Thnk you, Sir Edvard.
I am hoping to have such article post in future from you.
Thank you for nice submission at all times. Japanese regulation require to keep less than 3 kV/m in observing at 1 m above ground level in each case of DC and AC regardless of any frequency.